Compare nursing homes, on the government’s own records.
The loaded CMS Care Compare source file dated May 7, 2026 contains 14,699 nursing-home records. Available fields include star ratings, staffing, inspection findings, ownership, and Special Focus Facility status (85 records are designated); field availability varies by facility. Page-level source and methodology links are provided below.
Find nursing homes in your state →Selected CMS measures from loaded public snapshots
These are separate CMS measures, not a composite score. The facility samples below are ordered only within the measure shown, and their source scope and limits stay attached to each result.
Source: CMS Care Compare — Nursing Home Provider Information · CMS source date: 2026-04-29 · Snapshot: 2026-05-07 · Limitation: CMS ratings are periodic, may be unavailable, and do not rank facilities tied at the same star value.
Source: CMS Nursing Home Penalties · CMS source date: 2026-04-17 · Snapshot: 2026-05-08 · Limitation: Only CMS Fine rows are included; payment-denial days are excluded, and these records do not establish collection or current operating status.
Source: CMS Payroll-Based Journal (PBJ) Daily Nurse Staffing · CMS source date: 2026-04-16 · Snapshot: 2026-05-08 · Limitation: Only quarterly PBJ aggregates with at least 90 reported days, a positive census, and no availability flags are shown; HPRD is not a quality conclusion.
Facilities tied at the lowest available CMS overall rating
All listed facilities have the lowest available CMS overall rating: 1 out of 5; alphabetical ordering breaks ties and does not imply a further ranking.
| Facility | State | Overall rating |
|---|---|---|
| CENTENNIAL POST ACUTE | AK | 1 / 5 |
| KETCHIKAN MED CTR NEW HORIZONS TRANSITIONAL CARE | AK | 1 / 5 |
| MAPLE SPRINGS OF PALMER | AK | 1 / 5 |
| Polaris Extended Care | AK | 1 / 5 |
| ASPIRE PHYSICAL RECOVERY CENTER AT CAHABA RIVER | AL | 1 / 5 |
Source: CMS Care Compare — Nursing Home Provider Information · CMS source date: 2026-04-29 · Snapshot: 2026-05-07 · Limitation: CMS ratings are periodic, may be unavailable, and do not rank facilities tied at the same star value.
Lowest reported total-nurse HPRD among complete PBJ aggregates
These CY2025Q4 facility-quarter records are sorted by reported total nurse hours per resident day, then alphabetically for ties.
| Facility | State | Total nurse HPRD |
|---|---|---|
| CHEYENNE MANOR | CO | 0.086 |
| BEDFORD CO NURSING HOME | VA | 0.230 |
| VETERANS COMMUNITY LIVING CENTER AT FITZSIMONS | CO | 0.370 |
| OAKLAND NURSING CENTER | MI | 0.529 |
| IOSCO COUNTY MEDICAL CARE FACILITY | MI | 0.583 |
Source: CMS Payroll-Based Journal (PBJ) Daily Nurse Staffing · CMS source date: 2026-04-16 · Snapshot: 2026-05-08 · Limitation: Only quarterly PBJ aggregates with at least 90 reported days, a positive census, and no availability flags are shown; HPRD is not a quality conclusion.
85 records carry CMS's Special Focus Facility designation in the loaded May 7, 2026 source file, plus 441 SFF candidates — facilities CMS has flagged for repeat health-inspection deficiencies. CMS publishes the SFF list quarterly; this page does not imply that the loaded copy updates daily.
Source: CMS Care Compare · NH Provider Info · Source file 2026-05-07 · Publisher metadata 2026-04-29.
Medicare-Certified Nursing Homes
Records represented in the loaded CMS Care Compare NH Provider Information file, with identity, ownership, certification, bed-count, and star-rating fields where supplied.
Overall + component star ratings
CMS Overall, Health Inspection, Staffing, and Quality Measures ratings (each 1 to 5 stars), plus reported registered-nurse hours and total nurse hours per resident per day from the PBJ daily nurse staffing dataset.
Special Focus Facilities
Active SFF designations + 441 candidates flagged. CMS publishes the SFF list quarterly; Fonteum surfaces it as a per-facility column, not a footnote.
Federal data gap on nursing home ownership won't close — and Fonteum maps what CMS doesn't.
of CMS top-10-chain ownership percentages are missing in the CMS SNF All Owners dataset. The Trump administration suspended the mechanism that was supposed to close the gap. PE-owned nursing homes face higher resident mortality and greater bankruptcy risk.
53 states + territories with Medicare-certified nursing homes
States and territories represented in the loaded file link to the available state pages below. Export availability is documented on the dataset and audit-pack surfaces. The 2026 nursing-home statistics page isolates the facility, geography, and CMS rating counts from the named May 7 snapshot.
Federal healthcare exclusions for individual practitioners and entities. The LEIE × NH Provider Information cross-join is the audit-pack export endpoint's compliance signal — when a CCN's owners or staff appear in LEIE, the audit-pack envelope flags it explicitly.
See the OIG LEIE surface →What CMS health inspections found, at facility grain
In the current data (saved from CMS on the date below), state survey teams recorded health-deficiency citations against Medicare- and Medicaid-certified nursing homes, from surveys conducted between 2017-03-23 and 2026-03-25. Most citations describe a potential for harm; a minority describe proven injury. Fonteum keeps every citation at its facility (CMS Certification Number) and survey date — the grain a national average erases.
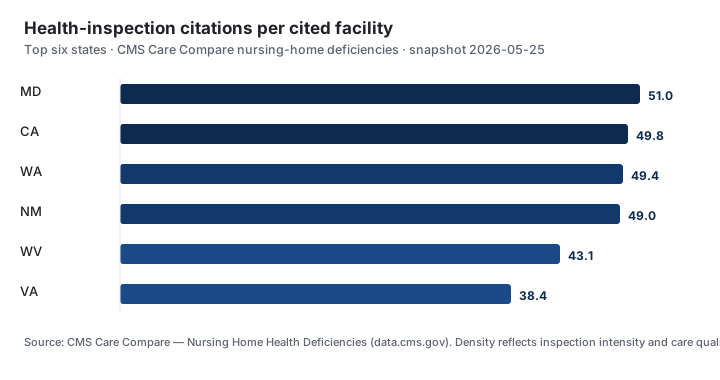
Inspection density by state — top 6 of 50+ jurisdictions
Citation density measures how many deficiencies each cited facility carries — a function of both care quality and how aggressively a state surveys. Maryland and California record the most citations per facility; their harm-level share differs sharply, which is why the raw count alone never tells the story.
| State | Citations | Cited facilities | Per facility | Harm-level % |
|---|---|---|---|---|
| MD | 11,219 | 220 | 51.00 | 1.86% |
| CA | 57,899 | 1,162 | 49.83 | 2.63% |
| WA | 9,575 | 194 | 49.36 | 4.38% |
| NM | 3,331 | 68 | 48.99 | 4.59% |
| WV | 5,305 | 123 | 43.13 | 3.15% |
| VA | 11,019 | 287 | 38.39 | 3.48% |
Related Fonteum data: the Payroll-Based Journal staffing dataset pairs each facility's deficiencies with its nurse hours per resident-day, and the SNF ownership records link citations to the chains and investors behind a facility. Federal exclusions appear on the OIG sanctions surface.
Methodology
Figures are computed directly from CMS primary files — not from an aggregator. The pipeline runs in five stages: (1) source acquisition from data.cms.gov, (2) matching records by CMS Certification Number, (3) survey-date join across the deficiency and provider-information files, (4) quality checks against published CMS row counts, and (5) a tamper-evident seal on the saved file. Each value is labeled with its source and date — never with unbacked trust language.
Every number on this page carries these four facts, plus ten more — down to the exact row of the source file it came from. The full field list is documented on the Care Compare nursing-home methodology page.
Source comparison: grain, cadence, and access
The same CMS files underlie most nursing-home data products. What differs is the grain you can reach, how often it refreshes, and whether a machine — or an AI system — can cite it.
| Source | Data grain | Cadence | Access | Source trail |
|---|---|---|---|---|
| Fonteum | Facility-level (CCN) | CMS monthly publisher cadence; saved 2026-05-25 | Free, machine-readable | Dataset/page citation; record-level fields vary |
| CMS Care Compare | Facility-level | CMS monthly publisher cadence | Free public access | CMS source-file documentation |
| Definitive Healthcare | Facility / system | See vendor documentation | Paid subscription | See vendor documentation |
| AHRQ | State / national | See source documentation | Public/research access varies by dataset | See source documentation |
Nursing home data — common questions
- How many US nursing homes have been cited for health deficiencies?
- CMS health-inspection surveys recorded 418,148 deficiency citations across 14,635 Medicare- and Medicaid-certified nursing homes in the saved May 25, 2026 snapshot, covering surveys from March 2017 through March 2026. Citation rows are keyed by CMS Certification Number and can include survey date, regulatory tag, and scope-severity letter.
- What share of nursing home deficiencies involve actual harm or immediate jeopardy?
- Of 418,148 citations, 23,375 (5.59%) carry a scope-severity code of G through L, meaning actual harm or immediate jeopardy to residents. Of those, 9,862 reached immediate-jeopardy level (codes J, K, or L), the most serious category CMS assigns. The remainder reflect potential for harm without a proven injury.
- Which states cite nursing homes most often?
- Maryland leads at 51.0 citations per cited facility, followed by California (49.8), Washington (49.4), New Mexico (49.0), and West Virginia (43.1). High citation density reflects inspection intensity as much as care quality. The downloadable facility rows support these saved-snapshot aggregates where source fields are present.
- What is a Special Focus Facility?
- A Special Focus Facility is a nursing home CMS has flagged for a persistent pattern of serious health-inspection deficiencies. CMS publishes the SFF list and a candidate list quarterly. Flagged facilities must show sustained improvement or face termination from Medicare and Medicaid. Fonteum renders SFF status as a per-facility column, not a footnote.
- How current is Fonteum's nursing home data?
- This page reflects the CMS Care Compare files saved on May 25, 2026, with health-inspection surveys spanning March 2017 through March 2026. CMS may publish newer files; the saved date shown here is the basis for these figures and is not a claim of ongoing same-cadence ingestion.
- How does Fonteum's nursing home data differ from Medicare's Care Compare?
- Both draw from CMS primary files. Medicare Care Compare provides its own facility and source-file views; Fonteum also publishes a machine-readable saved snapshot. Fonteum shows the dataset and saved-file date at page level, while record-level citation fields can be absent.
- Can I trace a specific nursing home statistic back to its source?
- Where citation metadata is available, a figure links to the named CMS dataset, issuing agency, and saved-file date. Record-level source fields can be absent. You can cross-check a facility at Medicare.gov Care Compare or download the underlying CMS file from data.cms.gov.
Sources
- Nursing Home — Provider Information — Centers for Medicare & Medicaid Services (CMS), Monthly. Primary source ↗ · Archive ↗
Used for: Facility identity, ownership, certification, bed counts, star ratings, SFF status. - Nursing Home — Health Deficiencies — Centers for Medicare & Medicaid Services (CMS), Monthly (rolling). Primary source ↗ · Archive ↗
Used for: Survey-level deficiency citations: regulatory tag, scope-severity, harm flag, correction status. - Payroll-Based Journal — Daily Nurse Staffing — Centers for Medicare & Medicaid Services (CMS), Quarterly. Primary source ↗ · Archive ↗
Used for: RN / LPN / CNA hours per resident-day used in the CMS staffing star rating. - Medicare Care Compare — Nursing Homes — U.S. Department of Health & Human Services (HHS), Monthly. Primary source ↗ · Archive ↗
Used for: Consumer-facing source of record for cross-checking any single facility.
Data last updated: 2026-05-25 · Reviewed by Jennifer Montecillo, MD · June 2026. Non-practicing medical reviewer.