CMS PBJ Daily Nurse Staffing Data
Fonteum structures the CMS Payroll-Based Journal — 1.3 million+ daily staffing records across 14,537 Medicare-certified nursing homes — for per-facility and state-level analysis. The dataset covers CY2025Q2 and spans RN, LPN, and CNA hours per resident per day, contract labor share, and weekend staffing patterns. Per-facility transparency is the only remaining accountability layer after the federal staffing minimum was rescinded in December 2025.
What PBJ data covers
The PBJ system requires every Medicare-certified nursing home to report daily staffing from actual payroll records. Unlike prior survey-based staffing estimates, PBJ data reflects who was on the clock each day — not what a facility claimed in a point-in-time survey. The quarterly extract covers:
- RN, LPN, CNA hours per resident per day (HPRD) — the primary staffing adequacy metric used in quality research and regulatory oversight.
- Contract/agency labor share — the percentage of nurse-hours filled by temporary staff rather than permanent employees.
- Weekend staffing — a separate HPRD calculation for Saturday and Sunday, which consistently runs below weekday levels at most facilities.
- Midnight resident count — the resident count at midnight, used to normalize HPRD calculations.
- Daily granularity — the underlying file has one row per facility per day, enabling time-series analysis of staffing trends, holiday dips, and weekend-to-weekday ratios.
Fonteum's CY2025Q2 snapshot covers the period after the Biden-era 3.48 HPRD minimum was rescinded. The national-mean total-nurse HPRD is 3.93 across 14,537 facilities; 57% meet the 4.1 HPRD policy-research threshold; 11% fall below 3.0 HPRD.
Who uses per-facility nursing home staffing data
Studies examining the relationship between PE ownership, staffing levels, and resident outcomes require daily-granularity PBJ data joined to ownership structure and quality ratings. Fonteum's CCN-keyed schema links PBJ directly to SNF All Owners and Care Compare on the facility identifier.
Staffing adequacy benchmarks and state-comparison tools need normalized HPRD data with a stated method. Fonteum's loaded PBJ table had a newest work date of June 30, 2025 when checked July 12, 2026; no quarterly platform cadence or universal snapshot history is promised.
Resident advocates, oversight programs, and CMS regional offices monitoring post-mandate-repeal staffing trends need per-facility and per-state staffing visibility. Fonteum's state disparity table (top-10 vs bottom-10 states by mean HPRD) is the fastest path to this layer.
Browse the live staffing surface → · Nursing Home Staffing Crisis study →
Frequently asked questions
- What is the CMS Payroll-Based Journal and what data does it contain?
- The CMS Payroll-Based Journal (PBJ) is a mandatory quarterly reporting system for Medicare-certified nursing homes. Each facility submits daily staffing records — hours worked per day by job category — based on actual payroll data rather than self-reported estimates. The dataset covers registered nurses (RN), licensed practical nurses (LPN), certified nursing assistants (CNA), and other direct-care staff. It includes midnight resident counts, contract/agency staff hours, and weekend-versus-weekday staffing patterns. CMS publishes the aggregated facility-level extract quarterly; the underlying daily-granularity file contains approximately 1.3 million rows per quarter.
- Why does per-facility PBJ data matter after the federal staffing minimum was repealed?
- The Biden-era federal minimum staffing rule (3.48 total nurse HPRD) was rescinded on December 3, 2025, effective February 2, 2026. With no federal floor enforceable, per-facility staffing transparency is the only remaining accountability mechanism for residents, families, researchers, and regulators. Fonteum continues to publish the PBJ dataset because the data itself is independent of the regulatory context — it documents what staffing levels actually are, not what any rule requires them to be.
- How does Fonteum structure PBJ data for facility-level analysis?
- Fonteum parses the CMS daily-granularity PBJ file and computes per-facility summary metrics: mean total nurse HPRD, RN HPRD, direct-care HPRD (RN+LPN+CNA), contract/agency labor percentage, and weekend HPRD. Summary statistics are precomputed for each quarter (current: CY2025Q2) and state-level rollups. The raw daily rows are preserved and exportable via the bulk endpoint. All metrics are tagged with the source quarter, source file hash, and methodology version string so analysis is reproducible from the CMS source CSV.
- Can I get nursing home staffing data filtered by state or facility type?
- Yes. The /staffing data surface includes state-level tables with top-10 and bottom-10 states by mean total-nurse HPRD. The data-platform API supports facility-level queries by CCN, state, and threshold (e.g., facilities below 3.0 HPRD or above 4.1 HPRD). The audit-pack export includes the full state-disparity table. For custom filters — by chain affiliation, quality star rating, or ownership type — the data-platform engagement covers joined exports linking PBJ staffing to SNF ownership and Care Compare quality data.
- Is CMS PBJ staffing data free to use for research and analysis?
- The underlying CMS PBJ data is published under U.S. Government Works and is freely redistributable. Fonteum's parsed, structured, and provenance-tagged version of the dataset is available under the data-platform commercial terms. Researchers affiliated with accredited institutions may qualify for the Fonteum Researcher API tier, which provides free access to PBJ summary statistics and state-level tables for non-commercial academic use.
Access the PBJ staffing data layer
The Audit Pack includes the PBJ state-disparity table and facility-level HPRD summary joined to Care Compare quality ratings and SNF ownership data. For daily-granularity exports or custom facility filters, contact the data engineering team.
How thinly US nursing homes are staffed, day by day
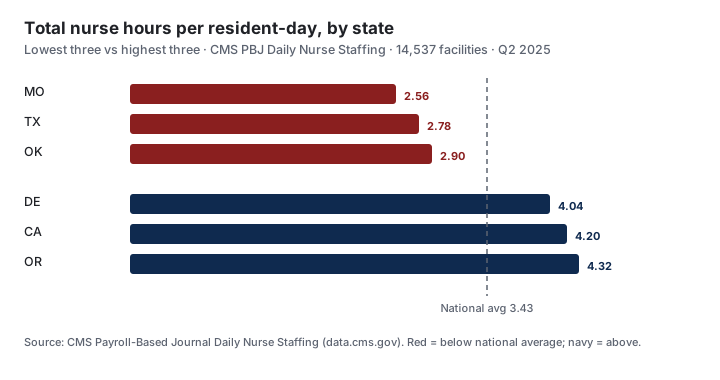
Across facility-days from 14,537 nursing homes in 2025 Q2, the census-weighted national average was total nurse hours per resident-day (HPRD) and 0.47 registered-nurse HPRD — both below the 3.48 total and 0.55 RN thresholds in the CMS minimum-staffing final rule. On 5.86% of facility-days, a facility reported zero registered-nurse hours at all.
The staffing gap is a geography
The same federal program produces a 1.8x range across states. Oklahoma reported zero RN hours on 25.4% of facility-days — more than four times the national rate — while Hawaii did so on 1.3%. PBJ is payroll-derived and auditable, so these gaps are not self-reported.
| State | Total HPRD | Zero-RN days | Facilities |
|---|---|---|---|
| MO | 2.56 | 11.8% | 481 |
| TX | 2.78 | 14.2% | 1,167 |
| OK | 2.90 | 25.4% | 274 |
| IN | 2.94 | 4.1% | 509 |
| State | Total HPRD | Zero-RN days | Facilities |
|---|---|---|---|
| OR | 4.32 | 7.5% | 126 |
| CA | 4.20 | 3.6% | 1,141 |
| HI | 4.18 | 1.3% | 42 |
| DE | 4.04 | 2.9% | 43 |
Related Fonteum data: the nursing-home Care Compare module pairs staffing with deficiencies and Special Focus status, the SNF ownership records link low staffing to chains and investors, and the staffing research study puts these figures in context.
Methodology
HPRD is computed from the CMS PBJ file as census-weighted nurse hours divided by resident days — not self-reported. The pipeline runs in five stages: (1) source acquisition from data.cms.gov, (2) entity resolution on the CCN, (3) per-facility-day hours-to-census ratio, (4) quality checks against published CMS aggregates, and (5) recording available snapshot metadata. Displayed values identify the CMS source and work-date period; attestation coverage is snapshot-specific, not a signature on each value.
These figures show the source and work-period metadata available to this page. The optional schema is documented on the data sources reference.
Source comparison: grain, cadence, and access
| Source | Data grain | Cadence | Access | Provenance |
|---|---|---|---|---|
| Fonteum | Facility-day (CCN) | Newest loaded work date: 2025-06-30; no platform cadence promised | API + bulk, free base | Nullable source metadata |
| CMS PBJ download | Facility-day | Quarterly | Free CSV, no API | None (raw file) |
| CMS Care Compare | Facility (rating) | Quarterly | Free, one at a time | None |
| Definitive Healthcare | Facility (annual) | Annual | Paid subscription | None |
Sources
- Payroll-Based Journal (PBJ) Daily Nurse Staffing — Centers for Medicare & Medicaid Services (CMS), Quarterly. Primary source ↗ · Archive ↗
Used for: Auditable daily RN / LPN / CNA hours and resident census per facility. - Minimum Staffing Standards for LTC Facilities (Final Rule, CMS-3442-F) — Centers for Medicare & Medicaid Services (CMS), published in the Federal Register, As issued. Primary source ↗ · Archive ↗
Used for: The 3.48 total and 0.55 RN HPRD thresholds used as comparison baselines. - Nursing Home — Provider Information — Centers for Medicare & Medicaid Services (CMS), Monthly. Primary source ↗ · Archive ↗
Used for: Facility identity and CMS staffing star rating joined on the CCN. - OIG LEIE — federal exclusions — U.S. Department of Health & Human Services, Office of Inspector General, Monthly. Primary source ↗ · Archive ↗
Used for: Compliance overlay for facilities whose owners or staff appear in LEIE.
Data last updated: 2025-06-30 · Reviewed by Jennifer Montecillo, MD · June 2026. Non-practicing medical reviewer.