cms-open-payments · CMS
cms-open-payments · CMS
cms-open-payments · CMS
cms-open-payments · CMS
Once a year, the Centers for Medicare & Medicaid Services publishes a complete ledger of the money that drug and medical-device companies move to American doctors. It exists because of the Physician Payments Sunshine Act, the Affordable Care Act provision that forces manufacturers and group purchasing organizations to disclose, payment by payment, every consulting fee, speaking honorarium, royalty check, research grant, and catered lunch. The 2024 release — published 2026-01-23 — holds 16,146,544 records.
Strip out research grants and ownership stakes and you are left with general payments: $3.31 billion that flowed to 979,136 distinct physicians and other providers from 1,763 reporting companies. Ask which company pays doctors the most, and the intuitive answer is "a big pharma brand." The data says something more specific — and the gap between who pays the most dollars and who reaches the most doctors turns out to be the whole story.
Device makers, not drug makers, sit at the top
The single largest payer of general-payment dollars in 2024 was BioNTech SE, at $180.6 million — paid across just 164 payments. Almost every dollar is royalty or license income tied to the mRNA platform the company co-developed. The second-largest payer, AbbVie at $156.4 million, could not be more different: it spread that money across 1.72 million separate payments.
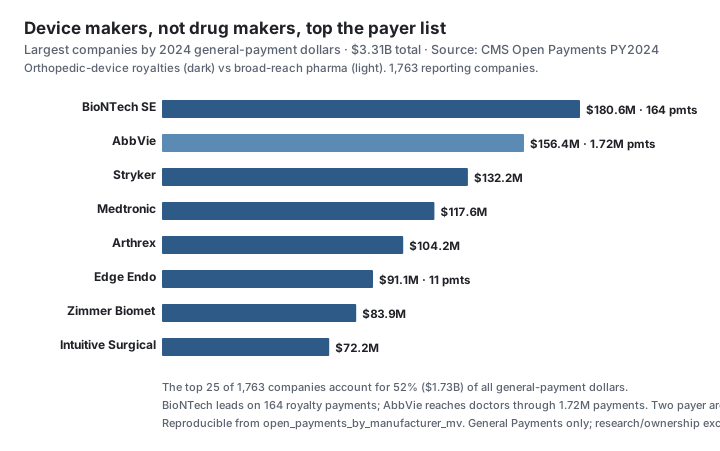
Behind BioNTech and AbbVie, the upper ranks are dominated by medical-device companies: Stryker ($132.2M), Medtronic ($117.6M), Arthrex ($104.2M), Zimmer Biomet ($83.9M), Intuitive Surgical ($72.2M), Boston Scientific ($61.4M), DePuy Synthes ($50.2M), Smith+Nephew ($46.4M), and Edwards Lifesciences ($27.8M). Device makers pay surgeons royalties for the intellectual property embedded in implants and instruments — payments that are few in number but very large per recipient. That is why a single orthopedic-device firm can out-pay most of the pharmaceutical industry on this measure.
The company that pays U.S. doctors the most does it through 164 checks. The company in second place does it through 1.72 million.
The top 25 of 1,763 companies hold most of the money
The payer field is concentrated. Of the 1,763 companies that reported any general payment in 2024, the top 25 account for $1.73 billion — 52% of every general-payment dollar. The remaining 48% is split among more than 1,700 smaller manufacturers and group purchasing organizations.
| Rank | Company | General payments (USD) | Payment count |
|---|---|---|---|
| 1 | BioNTech SE | $180,558,679 | 164 |
| 2 | AbbVie | $156,382,683 | 1,720,745 |
| 3 | Stryker Corporation | $132,155,940 | 162,439 |
| 4 | Medtronic, Inc. | $117,649,217 | 342,148 |
| 5 | Arthrex, Inc. | $104,199,464 | 49,443 |
| 6 | Edge Endo LLC | $91,139,127 | 11 |
| 7 | Zimmer Biomet Holdings | $83,904,351 | 32,760 |
| 8 | Intuitive Surgical, Inc. | $72,225,869 | 116,855 |
| 9 | Takeda Pharmaceuticals U.S.A. | $71,616,187 | 171,595 |
| 10 | Advanced Accelerator Applications | $63,931,988 | 167 |
| 11 | AstraZeneca Pharmaceuticals | $63,099,382 | 609,976 |
| 12 | Boston Scientific Corporation | $61,435,976 | 265,585 |
| 13 | Genentech, Inc. | $59,226,516 | 2,534 |
| 14 | Genzyme Corporation | $55,555,371 | 181,575 |
| 15 | DePuy Synthes Products, Inc. | $50,211,032 | 2,541 |
Source: CMS Open Payments PY2024, general payments only, via open_payments_by_manufacturer_mv.
Two payer archetypes
Set the dollar total beside the payment count and the file resolves into two distinct strategies for moving money to physicians.
| Archetype | Example | General payments | Payment count | Average per payment |
|---|---|---|---|---|
| Concentrated royalty | BioNTech SE | $180,558,679 | 164 | $1,101,089 |
| Concentrated royalty | Edge Endo LLC | $91,139,127 | 11 | $8,285,375 |
| Broad-reach pharma | AbbVie | $156,382,683 | 1,720,745 | $91 |
| Broad-reach pharma | AstraZeneca | $63,099,382 | 609,976 | $103 |
The contrast is the point. Edge Endo LLC disclosed $91.1 million across 11 payments — an average of more than $8 million each, reflecting an acquisition-related transfer to a small number of physician-owners. AbbVie's average general payment was $91: the cost of a sales rep's lunch. Both are legitimate, both are disclosed, and both count as "paying doctors" — but they are not the same activity.
An Open Payments record is a transfer of value, not evidence of influence. A $91 lunch and an $8 million royalty are recorded in the same file under the same statute. This study counts and ranks those transfers; it does not assert that any payment changed any clinical decision.Why the device-royalty pattern matters
The reason device makers cluster at the top is structural. When a surgeon's design ends up in a marketed implant, the manufacturer owes a royalty — often for years, often large. Those payments concentrate in a handful of high-volume orthopedic and cardiovascular specialists, which is why a company like Arthrex can rank fifth among all payers while making fewer than 50,000 payments, and why orthopedic surgery is the single highest-paid specialty in the file. The money and the recipients are tightly coupled: a small number of device firms paying a small number of surgeons very large sums.
Pharmaceutical marketing works the opposite way. Its general-payment footprint is built from millions of small food-and-beverage and speaker payments spread across hundreds of thousands of prescribers — broad, shallow, and frequent. The dollars are real, but per-doctor they are small. That is the pattern our companion analysis of the kinds of payments industry makes takes apart in detail.
What one record actually is
Each row in cms_open_payments is one reported transfer of value from a company (or group purchasing organization) to a covered recipient — a physician, a non-physician practitioner, or a teaching hospital — in a given program year, with the dollar amount and a payment-nature code. Manufacturers self-report under penalty of law, and CMS publishes the file without editing the underlying amounts. Because the unit is the payment, a company that buys 1.7 million lunches generates 1.7 million rows, while a company that pays four large royalties generates four. Every count and sum in this study aggregates those rows by manufacturer; none names a recipient.
Methodology
All figures are aggregations over the cms_open_payments table, populated from the CMS Open Payments program-year-2024 release (PGYR2024, published 2026-01-23, public, read-only). The table holds 16,146,544 records; because that is far above PostgREST's row cap, every aggregate is computed server-side in the open_payments_by_manufacturer_mv and open_payments_overview_mv materialized views rather than by selecting rows. "General payments" means records with payment type general — excluding research and ownership. Company totals use the reporting-entity name as published by CMS; no entity-resolution merge is applied across name variants, so a parent and a subsidiary that report separately appear separately. The exact query is in the reproducibility block below and on the Open Payments dataset page. Methodology version: open-payments/v1.
Limitations
- Snapshot, not a trend. These figures reflect the 2026-01-23 PY2024 release. CMS restates prior years and publishes a new file annually; rankings shift.
- Reported names, not resolved entities. Totals are grouped by the company name as reported. A corporate family that files under several legal entities is not consolidated here, so true parent-company totals may be higher.
- General payments only. Research ($8.49B) and ownership ($147.8M) are excluded; this is the consulting / speaking / royalty / food / travel bucket.
- Gross transfers, not net benefit. A royalty reflects licensed intellectual property; a consulting fee reflects work performed. The dollar figure is the transfer, not a measure of profit or influence.
- Disclosure, not wrongdoing, and aggregate-only. Open Payments is a transparency record. No figure here implies misconduct, and no individual physician is named or surfaced.
Sources
- CMS — Open Payments (openpaymentsdata.cms.gov) — the federal disclosure database and the source of every figure in this study.
- CMS — Open Payments data dictionary and methodology — payment-nature codes, covered recipients, and reporting rules.
- Physician Payments Sunshine Act — 42 U.S.C. §1320a-7h — the statute requiring manufacturer disclosure.
- 42 CFR Part 403, Subpart I — Transparency Reports and Reporting of Physician Ownership — the implementing regulation governing what must be reported.
Frequently asked questions
- What is Open Payments and the Sunshine Act?
- Open Payments is the federal transparency program created by the Physician Payments Sunshine Act, a provision of the Affordable Care Act. It requires drug and medical-device manufacturers and group purchasing organizations to report payments and transfers of value made to physicians and teaching hospitals. CMS publishes the data annually at openpaymentsdata.cms.gov.
- Which company paid U.S. doctors the most in 2024?
- By general-payment dollars, BioNTech SE was the largest single payer at $180.6 million across just 164 payments — almost entirely royalty or license income tied to its mRNA platform. AbbVie was second at $156.4 million, but spread that across 1.72 million separate payments, making it the broadest-reach payer in the file.
- Why are device companies near the top of the payer list?
- Medical-device makers pay surgeons royalties for intellectual property used in implants and instruments, and those royalties are large per recipient. Stryker ($132.2M), Medtronic ($117.6M), Arthrex ($104.2M) and Zimmer Biomet ($83.9M) all rank in the top eight payers — driven by orthopedic-device royalties rather than the small, frequent meals that characterize pharma marketing.
- How concentrated is the payer field?
- Highly. Of 1,763 companies that reported general payments in 2024, the top 25 account for $1.73 billion — 52% of every general-payment dollar. The long tail of more than 1,700 smaller manufacturers and group purchasing organizations splits the remaining 48%.
- Does a large industry payment mean a doctor did something wrong?
- No. These are lawful, federally disclosed payments, and many reflect legitimate work — royalties on invented devices, paid consulting, or research support. The data shows correlation and scale, not wrongdoing. Open Payments exists so that patients, journalists and researchers can see the financial relationships, not to assert misconduct.
- Do these figures include research payments?
- No. This study covers general (non-research) payments only — the $3.31 billion bucket that includes consulting, speaking, royalties, food and travel. Open Payments separately reports $8.49 billion in research payments and $147.8 million in ownership interests for 2024; those flow largely to institutions and principal investigators and are analyzed in our companion national overview.
- Can I reproduce these company rankings?
- Yes. Every figure is an aggregation over the cms_open_payments table (16,146,544 records, program year 2024) via the open_payments_by_manufacturer_mv materialized view. The exact SQL is published in the reproducibility block below. No individual physician is named; aggregates are by company only.
Who uses this data
The source data behind this study is public
Compliance teams, journalists, and researchers work from the same federal source families cited above — queried by NPI or facility identifier through Fonteum’s open dataset pages and API. Every figure traces to a frozen, downloadable snapshot you can reproduce yourself.
Datasets used
Reproducibility
Every claim, reproducible
The SQL
-- Which companies pay U.S. doctors the most? — fully reproducible query.
--
-- Source:   CMS Open Payments, program year 2024 (PGYR2024, published 2026-01-23).
-- Table:    public.cms_open_payments (16,146,544 records, public, read-only).
-- Scope:    General (non-research) payments only  (record_type = 'general').
-- Identity: one row = one reported transfer of value from a company to a covered
--           recipient. Aggregates are by manufacturer only; no recipient is named.
--
-- The study reads the bounded open_payments_by_manufacturer_mv / _overview_mv
-- materialized views; their exact definitions are reproduced here.

-- Headline totals (open_payments_overview_mv):
SELECT
  count(*) FILTER (WHERE record_type = 'general')                     AS general_records, -- 15,385,047
  round(sum(total_amount_usd) FILTER (WHERE record_type = 'general')) AS general_value,   -- 3,313,801,737
  count(DISTINCT recipient_npi) FILTER
    (WHERE record_type = 'general' AND recipient_npi IS NOT NULL)     AS recipients,      -- 979,136
  count(DISTINCT manufacturer_name) FILTER
    (WHERE record_type = 'general' AND manufacturer_name IS NOT NULL) AS companies        -- 1,763
FROM public.cms_open_payments
WHERE program_year = 2024;

-- Top 15 companies by general-payment dollars (open_payments_by_manufacturer_mv):
SELECT
  manufacturer_name                  AS manufacturer,
  count(*)                           AS payment_count,
  round(sum(total_amount_usd))::bigint AS general_payments
FROM public.cms_open_payments
WHERE record_type = 'general' AND program_year = 2024 AND manufacturer_name IS NOT NULL
GROUP BY manufacturer_name
ORDER BY general_payments DESC
LIMIT 15;
--  BioNTech SE                        180,558,679        164   <- largest payer; royalty income
--  ABBVIE INC.                        156,382,683  1,720,745   <- broadest reach; avg $91/payment
--  Stryker Corporation                132,155,940    162,439
--  Medtronic, Inc.                    117,649,217    342,148
--  Arthrex, Inc.                      104,199,464     49,443
--  Edge Endo LLC                       91,139,127         11   <- avg $8.3M/payment (acquisition)
--  Zimmer Biomet Holdings, Inc.        83,904,351     32,760
--  INTUITIVE SURGICAL, INC.            72,225,869    116,855
--  Takeda Pharmaceuticals U.S.A.       71,616,187    171,595
--  Advanced Accelerator Applications   63,931,988        167
--  AstraZeneca Pharmaceuticals LP      63,099,382    609,976
--  Boston Scientific Corporation       61,435,976    265,585
--  Genentech, Inc.                     59,226,516      2,534
--  GENZYME CORPORATION                 55,555,371    181,575
--  DePuy Synthes Products, Inc.        50,211,032      2,541

-- Payer concentration — top 25 share of all general-payment dollars:
WITH ranked AS (
  SELECT manufacturer_name, sum(total_amount_usd) AS amt
  FROM public.cms_open_payments
  WHERE record_type = 'general' AND program_year = 2024 AND manufacturer_name IS NOT NULL
  GROUP BY manufacturer_name
  ORDER BY amt DESC
  LIMIT 25
)
SELECT
  round(sum(amt))::bigint                                             AS top25_value,  -- 1,731,853,106
  round(100.0 * sum(amt) / (SELECT sum(total_amount_usd)
                            FROM public.cms_open_payments
                            WHERE record_type = 'general' AND program_year = 2024), 1) AS top25_pct -- 52.3
FROM ranked;
The snapshot
| dataset_id | cms-open-payments |
| snapshot_date | 2026-01-23 |
The JOINs
general_value        = sum(total_amount) where payment_type = 'general'   -- $3,313,801,737
reporting_companies  = count(distinct manufacturer)                       -- 1,763
recipients           = count(distinct recipient_npi)                      -- 979,136
top_payer            = max by sum(total_amount) per manufacturer          -- BioNTech SE $180,558,679 / 164 payments
top25_share          = sum(top 25 manufacturer totals) / general_value    -- $1,731,853,106 / $3,313,801,737 = 52.3%
The pipeline version
| methodology_version | open-payments/v1 |
Reproduce this
Run the exact query against the frozen 2026-01-23.
Cite this study
Citation-ready for researchers and AI.
Check the chain
The cited snapshot identifies the federal file. Where an attestation is present, its file hash can be re-derived; figures are not individually signed.
cms-open-payments · 2026-01-23Not suppliedInspect supplied artifact- FINANCIAL DISTRESS · JUN 2026Which medical specialties take the most industry money?In 2024, U.S. orthopedic surgeons received $381.4 million in general industry payments — more than any other specialty and over three times the second-place field. Counting spine, joint and sports-medicine subspecialties, orthopedics drew $531.8 million, about 16% of the $3.31 billion total. The average orthopedic payment was $1,711; the average internal-medicine payment was $96.
- FINANCIAL DISTRESS · JUN 2026What pharma actually buys: food, travel, consulting and royaltiesIndustry made 15.4 million general payments to U.S. physicians in 2024, worth $3.31 billion — but the two halves barely overlap. Royalties, speaking and consulting are 2.9% of payments yet 63% of the dollars; food and beverage is 91.7% of payments but 12.4% of the money. The average meal was $29; the average royalty, $56,258.
- FINANCIAL DISTRESS · JUN 2026Industry payments to physicians by state: where the money landsIndustry's $3.31 billion in 2024 general payments to physicians spread across 59 U.S. jurisdictions, but not in proportion to population. California led at $334.5 million, yet Pennsylvania ranked third and Massachusetts fourth on far fewer payments — Massachusetts averaged $1,031 per payment against Texas's $153. Where royalty recipients live, not where patients are, shapes the map.
- FINANCIAL DISTRESS · JUN 2026The OIG exclusion list, explained: who gets barred from Medicare, and whyThe OIG List of Excluded Individuals and Entities (LEIE) holds 68,055 active exclusions spanning 1977–2026. The most common reason to be barred from Medicare is not fraud — it is losing a state license: §1128(b)(4) license actions are 41% of the list. And only 10.3% of records carry an NPI, so the list is mostly non-clinicians.
- FINANCIAL DISTRESS · JUN 2026For Profit vs Nonprofit Hospitals: Who Owns Them, Who ProfitsAcross 6,019 US hospitals in the federal HCRIS cost reports, for-profit facilities are the only ownership class earning a positive average operating margin — +0.19% — while nonprofit hospitals average −4.75% and government hospitals −62.38%. The ranking holds on every measure, but the gap is narrower than the averages suggest.
Federal source citations
Fonteum LLC · June 12, 2026 · All figures trace to the frozen federal-data snapshot cited above.