cms-open-payments · CMS
cms-open-payments · CMS
cms-open-payments · CMS
cms-open-payments · CMS
The Open Payments file records the recipient's state for every payment, which turns the $3.31 billion in 2024 general (non-research) industry payments into a map. The intuitive expectation is that the map tracks population — the biggest states get the most money. It half-does. The states with the most payments are indeed the biggest ones. But the states with the most dollars are bent by something else entirely: where a small number of royalty recipients happen to live.
California leads, but the order is not population order
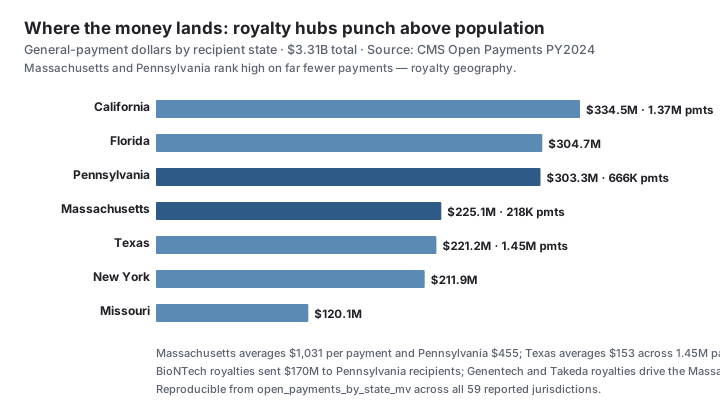
California received the most: $334.5 million across 1.37 million payments. Then Florida ($304.7M), Pennsylvania ($303.3M), Massachusetts ($225.1M), Texas ($221.2M), and New York ($211.9M). Texas — the second-largest state — sits fifth on dollars, behind both Pennsylvania and Massachusetts, neither of which is close to Texas in population.
The intensity map is the real story
Divide each state's dollars by its payment count and the distortion becomes legible.
| State | General payments (USD) | Payment count | Average per payment |
|---|---|---|---|
| Massachusetts | $225,083,292 | 218,332 | $1,031 |
| Pennsylvania | $303,312,778 | 665,965 | $455 |
| Missouri | $120,120,501 | 326,555 | $368 |
| California | $334,476,958 | 1,370,072 | $244 |
| Florida | $304,725,698 | 1,347,271 | $226 |
| New York | $211,935,025 | 1,032,846 | $205 |
| Texas | $221,196,400 | 1,445,102 | $153 |
Source: CMS Open Payments PY2024, general payments only, via open_payments_by_state_mv.
Massachusetts averaged $1,031 per payment — more than four times California's $244 and nearly seven times Texas's $153. A state can reach the top of the dollar rankings two different ways: with a vast number of small payments (Texas, California — population and marketing reach) or with a modest number of very large ones (Massachusetts, Pennsylvania — royalties). The average-payment column tells you which.
Texas logged 1.45 million industry payments and Massachusetts 218,000 — yet Massachusetts took home more money. Royalties, not meals, draw the map.
Two states, two companies
The royalty geography is traceable to specific firms. Pennsylvania's third-place finish rests heavily on a single company: the three largest royalty payments in the entire 2024 file — $88.6 million, $53.4 million, and $28.3 million — all came from BioNTech to Pennsylvania recipients, $170.3 million in total. That one royalty relationship is most of the gap between Pennsylvania and the similarly sized states below it.
Massachusetts shows the same mechanism with different names: the next cluster of the largest royalty payments went from Genentech and Takeda to Massachusetts recipients — together roughly $77 million among the file's ten biggest royalty checks. These are the same device-and-pharma royalty relationships that put device makers atop the payer list and orthopedic and procedural specialists atop the specialty list; geography simply records where those few recipients live.
A state ranking by total dollars is partly a map of corporate research hubs. When a handful of large royalty recipients live near a company's R&D center, their state's total rises sharply — independent of how many physicians practice there or how many patients they see.Volume versus value, by state
The reason the two maps diverge is the payment-type split playing out geographically. The big-population states accumulate dollars through sheer volume of small food-and-beverage payments — Texas's 1.45 million payments are overwhelmingly meals. The royalty-hub states accumulate dollars through a few enormous transfers. Both are legitimate and both are disclosed, but they describe different relationships between industry and medicine, and the per-payment average is the single number that distinguishes them.
What one record actually is
Each row in cms_open_payments carries the recipient's state — the physician's or teaching hospital's listed location — assigned by the reporting company. A payment is attributed to that state regardless of where the company or the recipient's patients are based. The file's 59 jurisdictions include the 50 states, DC, Puerto Rico and other territories, and military-mail designations (AE, AP, AA). Every figure aggregates these rows by state; none names a recipient.
Methodology
All figures are aggregations over the cms_open_payments table, populated from the CMS Open Payments program-year-2024 release (PGYR2024, published 2026-01-23, public, read-only). The table holds 16,146,544 records; state totals are computed server-side in the open_payments_by_state_mv and open_payments_overview_mv materialized views. "General payments" means records with record type general, excluding research and ownership. State grouping uses the CMS recipient_state field. Company-to-state royalty attributions reference the open_payments_largest_general_mv view of the fifty largest individual general payments. The exact query is in the reproducibility block below and on the Open Payments dataset page. Methodology version: open-payments/v1.
Limitations
- Snapshot, not a trend. Figures reflect the 2026-01-23 PY2024 release; CMS publishes annually and restates prior years.
- Recipient location, not patient location. Payments map to where the paid physician or teaching hospital is listed, not to where care is delivered or where the company sits.
- Totals are population-confounded. Absolute dollars partly track state size and provider supply; per-payment averages are the like-for-like comparison and are reported alongside.
- General payments only. Research ($8.49B) and ownership ($147.8M) are excluded.
- Disclosure, not influence, and aggregate-only. A state total reflects recipient location and payment mix, not any effect on care. No individual physician is named or surfaced.
Sources
- CMS — Open Payments (openpaymentsdata.cms.gov) — the federal disclosure database behind every figure in this study.
- CMS — Open Payments data dictionary and methodology — recipient-state coding and reporting rules.
- Physician Payments Sunshine Act — 42 U.S.C. §1320a-7h — the statute requiring manufacturer disclosure.
- 42 CFR Part 403, Subpart I — Transparency Reports — the implementing regulation.
Frequently asked questions
- Which state received the most industry payments in 2024?
- California, at $334.5 million in general (non-research) Open Payments across 1.37 million payments. Florida ($304.7M) and Pennsylvania ($303.3M) follow, then Massachusetts ($225.1M), Texas ($221.2M) and New York ($211.9M). The data covers 59 jurisdictions, including states, DC, territories, and military-mail designations.
- Why do Pennsylvania and Massachusetts rank so high for their size?
- Because large royalty payments land where the inventors live, not where patients are. Massachusetts averaged $1,031 per payment — driven by Genentech and Takeda royalties to local recipients — while Pennsylvania's third-place rank rests largely on $170.3 million in BioNTech royalty payments. Both states punch far above their population on industry dollars.
- What does the average payment per state tell you?
- It separates marketing reach from royalty money. Texas logged the most payments of any state (1.45 million) but averaged just $153 each — a meal-driven footprint. Massachusetts logged only 218,000 payments but averaged $1,031 — a royalty-driven one. High dollars with low payment counts signal concentrated royalties; the reverse signals broad pharmaceutical marketing.
- Are these payments assigned by where the patient lives?
- No. Payments are attributed to the recipient's state — the physician's or teaching hospital's listed location — not to any patient. A royalty paid to a surgeon in Pennsylvania counts toward Pennsylvania regardless of where that surgeon's patients or the company are based. The map shows where paid recipients are, not where care is delivered.
- Do bigger states always get more money?
- Largely, but not strictly. Population and provider supply put California, Texas, Florida and New York near the top on payment volume. But total dollars break from population whenever a few large royalty recipients live in a state — which is why Massachusetts and Pennsylvania outrank Texas on dollars despite far fewer payments and smaller populations.
- Does a high state total mean physicians there are influenced more?
- No. A state total reflects where paid recipients are located and the mix of payment types they receive — not any effect on prescribing or care. This is a geographic disclosure summary. Nothing here implies that physicians in higher-total states practice differently.
- Can I reproduce these state figures?
- Yes. Every figure aggregates the cms_open_payments table (16,146,544 records, program year 2024) through the open_payments_by_state_mv materialized view across all 59 reported jurisdictions. The exact SQL is in the reproducibility block below. No individual physician is named; aggregates are by state only.
Who uses this data
The source data behind this study is public
Compliance teams, journalists, and researchers work from the same federal source families cited above — queried by NPI or facility identifier through Fonteum’s open dataset pages and API. Every figure traces to a frozen, downloadable snapshot you can reproduce yourself.
Datasets used
Reproducibility
Every claim, reproducible
The SQL
-- Industry payments to physicians by state — reproducible query.
--
-- Source:   CMS Open Payments, program year 2024 (PGYR2024, published 2026-01-23).
-- Table:    public.cms_open_payments (16,146,544 records, public, read-only).
-- Scope:    General (non-research) payments only  (record_type = 'general').
-- Grain:    recipient_state (59 jurisdictions). No recipient named.
--
-- Reads open_payments_by_state_mv and open_payments_largest_general_mv.

-- Top states by general-payment dollars, with per-payment intensity:
SELECT
  recipient_state                                  AS state,
  count(*)                                         AS payments,
  round(sum(total_amount_usd))::bigint             AS total_usd,
  round(sum(total_amount_usd) / count(*), 0)       AS avg_per_payment
FROM public.cms_open_payments
WHERE record_type = 'general' AND program_year = 2024 AND recipient_state IS NOT NULL
GROUP BY recipient_state
ORDER BY total_usd DESC
LIMIT 7;
--  CA  334,476,958  1,370,072    244
--  FL  304,725,698  1,347,271    226
--  PA  303,312,778    665,965    455   <- royalty hub (BioNTech)
--  MA  225,083,292    218,332  1,031   <- highest intensity (Genentech / Takeda royalties)
--  TX  221,196,400  1,445,102    153   <- highest payment count, lowest intensity
--  NY  211,935,025  1,032,846    205
--  MO  120,120,501    326,555    368

-- Jurisdiction count:
SELECT count(DISTINCT recipient_state) AS jurisdictions                            -- 59
FROM public.cms_open_payments
WHERE record_type = 'general' AND program_year = 2024 AND recipient_state IS NOT NULL;

-- Royalty geography — the largest individual general payments and their states
-- (open_payments_largest_general_mv): BioNTech -> PA = $170.3M across ranks 2-4;
-- Genentech + Takeda -> MA ~ $76.7M across ranks 7-12.
SELECT rank, amount, nature, manufacturer, state
FROM public.open_payments_largest_general_mv
WHERE nature = 'Royalty or License'
ORDER BY rank
LIMIT 12;
--  2   88,596,339  Royalty or License  BioNTech SE   PA
--  3   53,413,600  Royalty or License  BioNTech SE   PA
--  4   28,269,974  Royalty or License  BioNTech SE   PA   (BioNTech->PA subtotal = 170,279,913)
--  7   16,066,655  Royalty or License  Takeda        MA
--  8   13,180,782  Royalty or License  Genentech     MA
--  9   12,477,310  Royalty or License  Genentech     MA
--  10  12,070,094  Royalty or License  Genentech     MA
--  11  11,794,348  Royalty or License  Genentech     MA
--  12  11,134,507  Royalty or License  Takeda        MA   (Genentech+Takeda->MA subtotal = 76,723,696)
The snapshot
| dataset_id | cms-open-payments |
| snapshot_date | 2026-01-23 |
The JOINs
general_value   = sum(total_amount_usd) where record_type='general'             -- $3,313,801,737
jurisdictions   = count(distinct recipient_state)                               -- 59
top_state       = max by sum per recipient_state                                -- CA $334,476,958 / 1,370,072 payments
ma_avg_payment  = MA_usd / MA_payments                                          -- $225,083,292 / 218,332 = $1,031
tx_avg_payment  = TX_usd / TX_payments                                          -- $221,196,400 / 1,445,102 = $153
The pipeline version
| methodology_version | open-payments/v1 |
Reproduce this
Run the exact query against the frozen 2026-01-23.
Cite this study
Citation-ready for researchers and AI.
Check the chain
The cited snapshot identifies the federal file. Where an attestation is present, its file hash can be re-derived; figures are not individually signed.
cms-open-payments · 2026-01-23Not suppliedInspect supplied artifact- FINANCIAL DISTRESS · JUN 2026Which companies pay U.S. doctors the most? Device makers, not pharmaIn 2024, drug and device companies disclosed $3.31 billion in general payments to U.S. physicians under the Sunshine Act — and the largest payers are device makers, not pharma. BioNTech led at $180.6 million from just 164 royalty payments; the top 25 of 1,763 reporting companies account for 52% of every general-payment dollar.
- FINANCIAL DISTRESS · JUN 2026Which medical specialties take the most industry money?In 2024, U.S. orthopedic surgeons received $381.4 million in general industry payments — more than any other specialty and over three times the second-place field. Counting spine, joint and sports-medicine subspecialties, orthopedics drew $531.8 million, about 16% of the $3.31 billion total. The average orthopedic payment was $1,711; the average internal-medicine payment was $96.
- FINANCIAL DISTRESS · JUN 2026What pharma actually buys: food, travel, consulting and royaltiesIndustry made 15.4 million general payments to U.S. physicians in 2024, worth $3.31 billion — but the two halves barely overlap. Royalties, speaking and consulting are 2.9% of payments yet 63% of the dollars; food and beverage is 91.7% of payments but 12.4% of the money. The average meal was $29; the average royalty, $56,258.
- FINANCIAL DISTRESS · JUN 2026The OIG exclusion list, explained: who gets barred from Medicare, and whyThe OIG List of Excluded Individuals and Entities (LEIE) holds 68,055 active exclusions spanning 1977–2026. The most common reason to be barred from Medicare is not fraud — it is losing a state license: §1128(b)(4) license actions are 41% of the list. And only 10.3% of records carry an NPI, so the list is mostly non-clinicians.
- FINANCIAL DISTRESS · JUN 2026For Profit vs Nonprofit Hospitals: Who Owns Them, Who ProfitsAcross 6,019 US hospitals in the federal HCRIS cost reports, for-profit facilities are the only ownership class earning a positive average operating margin — +0.19% — while nonprofit hospitals average −4.75% and government hospitals −62.38%. The ranking holds on every measure, but the gap is narrower than the averages suggest.
Federal source citations
Fonteum LLC · June 12, 2026 · All figures trace to the frozen federal-data snapshot cited above.