cms-part-d-prescribers · CMS
cms-part-d-prescribers · CMS
cms-part-d-prescribers · CMS
cms-part-d-prescribers · CMS
The drug Medicare spends the most on and the drug it prescribes the most are almost never the same drug. In 2024, the single costliest drug in Medicare Part D was Eliquis, a blood thinner, at $19.88 billion — yet Eliquis was only the program's 12th most-prescribed drug. The most-prescribed drug, the generic statin atorvastatin, was filled 72.5 million times but cost the program just $749 million. That inversion is not an accident. It is the structure of the entire program.
Two prescribing economies in one program
Part D runs on two separate economies that barely overlap. One is built on volume: enormous numbers of cheap generic prescriptions for the chronic conditions of an older population — high cholesterol, high blood pressure, diabetes, reflux. The other is built on price: a smaller number of expensive brand-name prescriptions, many of them for cardiovascular disease, cancer, and immune conditions.
The split is stark. Across all of Part D in 2024:
| Share of claims | Share of cost | |
|---|---|---|
| Generic-dispensed drugs | 76.1% | 9.9% |
| Brand-name drugs | 23.9% | 90.1% |
Three-quarters of every prescription is a generic, but those generics are only one-tenth of the spending. Brand-name drugs are the reverse: under a quarter of prescriptions, more than nine-tenths of the dollars. A program that looks, by prescription count, like a generic-drug program is, by dollars, almost entirely a brand-name program.
The drug Medicare spends the most on and the drug it prescribes the most are almost never the same drug.
The most-prescribed drugs are almost all generic
Rank Part D drugs by how often they are filled and the top of the list is a catalogue of inexpensive generics. Atorvastatin leads at 72.5 million claims, then amlodipine (49.2M), levothyroxine (42.5M), gabapentin (35.5M), losartan (35.4M), and lisinopril (35.4M). Every one of the 11 most-prescribed drugs is a generic. They cost a few dollars per fill, so even at tens of millions of claims their total spend stays modest — atorvastatin's 72.5 million claims cost less than $750 million.
The first brand-name drug does not appear until rank 12: Eliquis. That single fact captures the whole pattern — you can read eleven of the most common prescriptions in America before you reach a drug that moves the budget.
The costliest drugs are almost all brand-name
Re-rank the same data by total cost and a completely different list appears.
| Rank by cost | Drug | 2024 Part D cost | Claims | Most-prescribed rank |
|---|---|---|---|---|
| 1 | Eliquis | $19.88B | 22,996,543 | 12 |
| 2 | Ozempic | $12.38B | 9,930,484 | — |
| 3 | Jardiance | $10.68B | 10,654,599 | — |
| 4 | Mounjaro | $5.83B | 4,694,896 | — |
| 5 | Xarelto | $5.44B | 5,888,827 | — |
| 6 | Trelegy Ellipta | $4.83B | 5,725,949 | — |
| 7 | Trulicity | $4.79B | 3,816,376 | — |
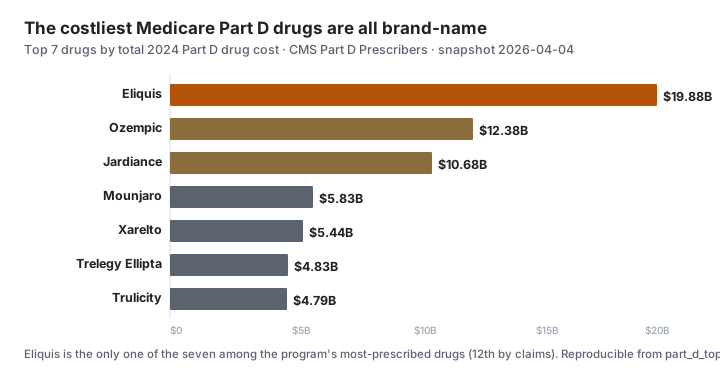
Eliquis is the rare drug that is both very common and very expensive — 23.0 million claims at a brand price. Its $19.88 billion is 8.8% of all Part D drug cost on a single product. Below it, the costliest drugs are brand cardiometabolic agents — the GLP-1 diabetes drugs Ozempic, Mounjaro, and Trulicity, and the SGLT2 inhibitors Jardiance and Farxiga — that we examine in the GLP-1 spending study.
When a tiny claim count produces a giant bill
The purest expression of the price economy is the specialty drug: a product with a small patient population and a list price high enough to land it among the costliest drugs in the program on almost no volume.
- Revlimid (lenalidomide), a cancer drug, cost Part D $3.79 billion on 217,318 claims — about $17,431 per claim.
- Vyndamax (tafamidis), for a heart-muscle disease, cost $2.50 billion on 98,896 claims — about $25,329 per claim.
- Humira, for autoimmune disease, cost $3.80 billion on 437,072 claims — about $8,683 per claim.
These drugs never appear on a most-prescribed list and never will. They matter because they show why ranking drugs by cost and ranking them by volume produce two different maps of the same program — and why any conversation about Medicare drug spending has to be clear about which map it is reading.
How this connects to the rest of Part D
This two-economies pattern is the backbone of the whole Part D data graph. The Medicare Part D drug-spending overview lays out the program totals; the GLP-1 study zooms into the fastest-growing brand class; the prescribing-by-specialty study shows how the price economy concentrates in oncology and the volume economy in primary care; and the by-state study maps where the dollars land. Every figure across the family is a drug-, specialty-, or state-level aggregate — no individual prescriber is named.
Methodology
The two rankings come from two materialized views over the CMS Medicare Part D Prescribers "by Provider and Drug" 2024 file (snapshot 2026-04-04): part_d_top_drugs_by_cost_mv ranks drugs by sum(total_drug_cost), and part_d_top_drugs_by_claims_mv ranks them by sum(total_claims), each grouped by brand and generic name. The brand-versus-generic split follows the standard CMS convention: a row is generic-dispensed when its brand name equals its generic name (case-insensitive), brand otherwise; the two classes partition every row, so their claims and cost sum exactly to the program totals. Cost-per-claim is a drug's total cost divided by its total claims. The exact queries are in the reproducibility block below and trace to the Part D Prescribers dataset. Methodology version: part-d-costliest/v1.
Limitations
- Gross cost, not net. All cost figures are point-of-sale totals before confidential manufacturer rebates. Net Medicare spending, especially on brand drugs, is lower than the gross amounts shown.
- Brand-vs-generic by dispensing. The split classifies each prescription by whether it was dispensed as a brand or generic, the CMS convention. An authorized generic or a single-source brand can sit on the boundary; the partition is exact for accounting but is a billing label, not a clinical one.
- A single year. This is the 2024 release. Rankings shift as patents expire, generics launch, and new brands ramp; treat it as a snapshot.
- Cost is not appropriateness. A high total reflects price and volume, not whether any prescription was warranted. This study ranks spending; it does not evaluate prescribing.
- Aggregate-only. Every figure is a drug- or program-level total. No individual prescriber is named, surfaced, or attached to any profile.
Sources
- CMS — Medicare Part D Prescribers by Provider and Drug — the federal public-use file behind every ranking in this study.
- CMS — Medicare Part D Prescribers methodology — drug-name standardization, brand-versus-generic classification, and the fewer-than-11-claim suppression rule.
- KFF — A Primer on Medicare Part D Drug Spending — how list price, rebates, and generic substitution shape Part D spending.
- HHS ASPE — Medicare Part D and the generic/brand cost divide — federal analysis of where Part D dollars concentrate by drug type.
Frequently asked questions
- What is the most expensive drug in Medicare Part D?
- In 2024 it was Eliquis, a blood thinner, at $19.88 billion in total Part D drug cost. Ozempic was second at $12.38 billion and Jardiance third at $10.68 billion. All three are brand-name drugs with no generic competition, which is why they top the spending table.
- What is the most prescribed drug in Medicare Part D?
- Atorvastatin, a generic cholesterol statin, with 72.5 million claims in 2024 — far more than any other drug. It cost the program only $749 million, because as a generic it runs about ten dollars a fill. The 11 most-prescribed Part D drugs are all inexpensive generics.
- Why isn't the most-prescribed drug also the most expensive?
- Because price and volume run in opposite directions in Part D. The drugs prescribed most often are cheap generics that treat common chronic conditions. The drugs that cost the most are patent-protected brand-name products with high list prices. Eliquis is the costliest drug overall but only the 12th most-prescribed.
- How much of Medicare Part D spending goes to brand-name drugs?
- Brand-name drugs account for 90.1% of Part D drug cost — $204.4 billion of the $226.74 billion total — while making up just 23.9% of prescription claims. Generic drugs are the mirror image: 76.1% of claims but only 9.9% of the dollars.
- Which drugs cost the most per prescription in Medicare Part D?
- Specialty drugs with tiny patient populations. The cancer drug Revlimid averaged about $17,431 per Part D claim in 2024 and the heart drug Vyndamax about $25,329, versus roughly $153 across all Part D prescriptions. These drugs drive large totals on very few claims.
- Does a high drug cost mean Medicare is overpaying?
- Not on its own. These are gross costs before confidential manufacturer rebates, and a high total can reflect a large patient population, a high list price, or both. The data shows where the dollars concentrate; it does not judge whether any price or prescription was appropriate.
- Can I reproduce these drug-cost rankings?
- Yes. The costliest-drug and most-prescribed rankings come from two materialized views over the CMS Medicare Part D Prescribers 2024 file; the brand-versus-generic split comes from the overview view. The exact SQL is in the reproducibility block below and traces to a federal snapshot dated 2026-04-04.
Who uses this data
The source data behind this study is public
Compliance teams, journalists, and researchers work from the same federal source families cited above — queried by NPI or facility identifier through Fonteum’s open dataset pages and API. Every figure traces to a frozen, downloadable snapshot you can reproduce yourself.
Datasets used
Reproducibility
Every claim, reproducible
The SQL
-- Most expensive vs most-prescribed Medicare Part D drugs, 2024 — reproducible query.
--
-- Source:   CMS Medicare Part D Prescribers, "by Provider and Drug".
-- Snapshot: cms-part-d-prescribers / data year 2024 / CMS release 2026-04-04.
-- Base:     public.cms_part_d_prescribers (~28.0M prescriber × drug rows).
-- Reads:    the frozen materialized views from
--           supabase/migrations/20260612150000_part_d_prescribing_research_views.sql.
--           The two top-drug views are each GROUP BY brand_name, generic_name over
--           the 2024 base rows, ranked by cost and by claims respectively; the
--           overview view carries the brand-vs-generic partition.
--
-- The whole study is the contrast between two orderings of the same drugs.
-- Audit observation: 2026-07-14. Source release remains 2026-04-04.

-- audit-claim: costliest-drug-vector
SELECT rank, brand_name, generic_name, claims, cost,
       round(cost::numeric / claims, 2) AS cost_per_claim
FROM public.part_d_top_drugs_by_cost_mv
ORDER BY cost DESC
LIMIT 12;
--  1 Eliquis    Apixaban       22,996,543  $19,876,304,796  $864     <- costliest drug; 12th by claims
--  2 Ozempic    Semaglutide     9,930,484  $12,375,986,475  $1,246
--  3 Jardiance  Empagliflozin  10,654,599  $10,678,957,372  $1,002
--  4 Mounjaro   Tirzepatide     4,694,896  $5,825,295,741   $1,241
--  5 Xarelto    Rivaroxaban     5,888,827  $5,436,701,739   $923
--  6 Trelegy …                  5,725,949  $4,832,494,643   $844
--  7 Trulicity  Dulaglutide     3,816,376  $4,786,817,612   $1,254
--  9 Humira(Cf) Adalimumab        437,072  $3,795,159,532   $8,683   <- giant bill on few claims
-- 10 Revlimid   Lenalidomide      217,318  $3,788,009,700   $17,431  <- specialty cancer drug
-- 15 Vyndamax   Tafamidis          98,896  $2,504,980,201  $25,329.44  <- specialty heart drug

-- audit-claim: most-prescribed-drug-vector
SELECT rank, brand_name, generic_name, claims, cost,
       round(cost::numeric / claims, 2) AS cost_per_claim,
       lower(brand_name) = lower(generic_name) AS is_generic
FROM public.part_d_top_drugs_by_claims_mv
ORDER BY claims DESC
LIMIT 12;
--  1 Atorvastatin Calcium  72,474,420  $748,890,955   $10.33  generic
--  2 Amlodipine Besylate   49,241,894  $310,756,194   $6.31   generic
--  3 Levothyroxine Sodium  42,465,073  $456,346,665   ...     generic
--  ...  (ranks 1-11 are ALL generic)
-- 12 Eliquis   Apixaban     22,996,543  $19,876,304,796        brand   <- first brand on the list

-- audit-claim: brand-generic-partition
SELECT
  generic_claims, brand_claims,
  generic_cost,   brand_cost,
  round(100.0 * generic_claims / total_claims,    1) AS generic_claims_pct,  -- 76.1%
  round(100.0 * generic_cost   / total_drug_cost, 1) AS generic_cost_pct,    --  9.9%
  round(100.0 * brand_claims   / total_claims,    1) AS brand_claims_pct,    -- 23.9%
  round(100.0 * brand_cost     / total_drug_cost, 1) AS brand_cost_pct       -- 90.1%
FROM public.part_d_prescribing_overview_mv;
-- generic + brand claims sum exactly to total_claims; generic + brand cost to
-- total_drug_cost — the partition is by lower(brand_name) = lower(generic_name).

-- audit-claim: vyndamax-example
SELECT
  rank,
  brand_name,
  generic_name,
  claims,
  cost,
  round(cost::numeric / claims, 2) AS cost_per_claim
FROM public.part_d_top_drugs_by_cost_mv
WHERE lower(brand_name) = 'vyndamax';
The snapshot
| dataset_id | cms-part-d-prescribers |
| snapshot_date | 2026-04-04 |
The JOINs
top_by_cost   = part_d_top_drugs_by_cost_mv   order by cost desc   -- Eliquis $19,876,304,796 leads
top_by_claims = part_d_top_drugs_by_claims_mv order by claims desc -- Atorvastatin 72,474,420 claims leads
brand_cost_share  = overview_mv.brand_cost / overview_mv.total_drug_cost   -- 204,355,041,438 / 226,740,902,131 = 90.13%
brand_claim_share = overview_mv.brand_claims / overview_mv.total_claims     -- 353,740,012 / 1,479,628,807 = 23.91%
generic vs brand split via lower(brand_name) = lower(generic_name)
The pipeline version
| methodology_version | part-d-costliest/v1 |
Reproduce this
Run the exact query against the frozen 2026-04-04.
Cite this study
Citation-ready for researchers and AI.
Check the chain
The cited snapshot identifies the federal file. Where an attestation is present, its file hash can be re-derived; figures are not individually signed.
cms-part-d-prescribers · 2026-04-04Not suppliedInspect supplied artifact- CARE QUALITY · JUN 2026GLP-1 drugs now cost Medicare Part D $24.57 billion a yearGLP-1 drugs cost Medicare Part D $24.57 billion in 2024 — 10.8% of the entire program's drug spending on just 1.3% of its prescriptions. Ozempic alone, at $12.38 billion, is the second-costliest drug in Part D; Mounjaro and Trulicity push the class past $24 billion.
- WORKFORCE · JUN 2026Who prescribes Medicare's drug spending? Nurse practitioners now leadNurse practitioners drove $37.48 billion of Medicare Part D drug cost in 2024 — more than any other specialty, including internal medicine and cardiology. But the steepest bills come from oncology: hematology-oncologists averaged $2,441 per prescription, sixteen times the program-wide $153, on a fraction of the claims.
- ACCESS · JUN 2026Medicare Part D drug spending by state: where the dollars concentrateCalifornia prescribers drove $21.26 billion of Medicare Part D drug cost in 2024, the most of any state — followed by New York at $18.17 billion, Florida ($16.84 billion), and Texas ($15.75 billion). The four largest states alone account for nearly a third of the program's $226.74 billion in drug spending.
- WORKFORCE · JUN 2026PECOS Lookup: Who Is Enrolled in Medicare? (2026 Data)413,539 nurse practitioner enrollments make NPs the single most common clinician type in Medicare's provider-enrollment file — 13.9% of all 2.98 million PECOS records, nearly triple the largest physician specialty. Together, NPs and physician assistants are one in five enrollments. Advanced-practice providers now anchor the Medicare workforce.
- ACCESS · APR 2026A March spike in Medicare enrollment deactivations thinned provider supply in shortage areasMedicare enrollment deactivations in PECOS ran 28% above the trailing-twelve-month average in March 2026 — and the spike was not uniform. Deactivations in HRSA-designated shortage areas grew 41% against trend, versus 19% elsewhere. The places least able to absorb a departure lost providers fastest.
Federal source citations
Fonteum LLC · June 12, 2026 · All figures trace to the frozen federal-data snapshot cited above.