cms-part-d-prescribers · CMS
cms-part-d-prescribers · CMS
cms-part-d-prescribers · CMS
cms-part-d-prescribers · CMS
For most of Medicare's history, the answer to "who prescribes the most of its drug spending" was a physician. In 2024, it is not. The prescriber specialty attributed with the most Medicare Part D drug cost is the nurse practitioner, at $37.48 billion — ahead of internal medicine, family practice, and every physician specialty in the program. At the same time, the specialties that cost the most per prescription are not primary care at all, but oncology. The Part D data tells two stories about who spends Medicare's drug dollars, and they point in opposite directions.
Nurse practitioners are now the highest-cost prescriber specialty
Rank the 182 prescriber specialties in Part D by total drug cost and nurse practitioners sit at the top:
| Specialty | 2024 Part D cost | Claims | Cost per claim |
|---|---|---|---|
| Nurse practitioner | $37.48B | 269,894,701 | $138.86 |
| Internal medicine | $33.55B | 332,609,911 | $100.87 |
| Family practice | $29.17B | 371,050,213 | $78.63 |
| Hematology-oncology | $17.29B | 7,083,076 | $2,440.88 |
| Physician assistant | $13.56B | 95,064,409 | $142.63 |
| Cardiology | $13.49B | 64,689,193 | $208.59 |
The nurse-practitioner total is not driven by expensive choices — at $138.86 per claim, NPs sit between internal medicine and family practice. It is driven by scale. As our companion study on Medicare provider enrollment documents, the nurse practitioner is now the single most common clinician type enrolled in Medicare, ahead of every physician specialty. With the most prescribers, spread across primary care where prescription volume is highest, the class produces the largest total. Add physician assistants ($13.56 billion) and the two advanced-practice categories together account for $51.0 billion — 22.5% of all Part D drug cost.
The specialty that spends the most of Medicare's drug dollars and the specialty that writes the most prescriptions are no longer the same specialty.
Primary care carries the volume; oncology carries the price
Family practice writes 371 million claims — the most of any specialty — yet ranks third in total cost. Its prescriptions are the cheapest of the major specialties, at $78.63 per claim, because primary care runs on the generic drugs that dominate Part D by volume. The three primary-care categories — nurse practitioners, internal medicine, and family practice — together write 973 million claims (two-thirds of the program) and carry $100.2 billion, about 44% of all Part D drug cost.
Oncology is the mirror image. Hematology-oncology generated $17.29 billion on only 7.1 million claims — barely half a percent of program volume — at $2,440.88 per claim, sixteen times the program-wide average. Medical oncology runs similarly, at $2,394 per claim. These specialties prescribe the high-cost oral chemotherapy and specialty drugs — Revlimid, Imbruvica, Xtandi — that we rank in the most-expensive-drugs study. They sit near the top of the cost table on a tiny fraction of the prescriptions.
The cost-per-claim spread
The clearest way to see the two economies is to rank specialties not by total cost but by cost per claim — what an average prescription from each specialty does to the budget.
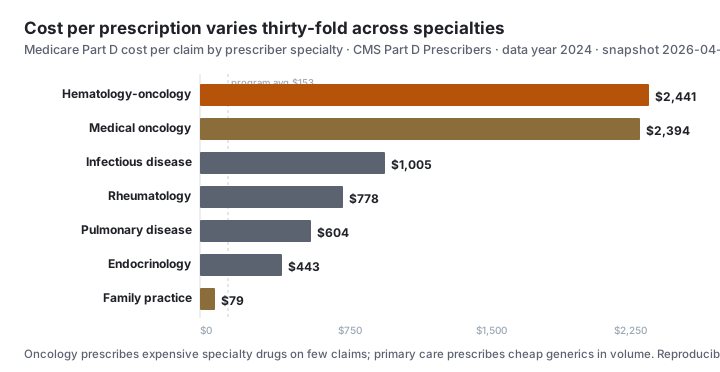
Infectious disease ($1,005), rheumatology ($778), pulmonary disease ($604), and endocrinology ($443) all run well above the program average, each because the conditions they treat — HIV, autoimmune disease, severe respiratory disease, advanced diabetes — require expensive brand drugs. Family practice, at $79, runs at half the average. The thirty-fold spread is a map of disease cost, not of prescribing behavior.
Why advanced-practice prescribing dominates the total
Part D attributes each claim to the prescriber who wrote it, by their self-reported CMS specialty. A drug prescribed by a nurse practitioner in a cardiology practice counts under nurse practitioner, not cardiology. The totals describe who signs the prescription, which is the right lens for workforce questions but is not the same as the clinical service line.The rise of advanced-practice prescribing in these numbers mirrors a shift Medicare's own advisors have tracked for years: nurse practitioners and physician assistants now deliver a growing share of clinician visits and increasingly bill — and prescribe — under their own identities rather than under a supervising physician. The Part D file is where that shift becomes visible in dollars. It is a workforce signal, not a quality signal: it tells you who is writing Medicare's prescriptions, and the answer is now, more than ever, an advanced-practice clinician in primary care.
How this connects to the rest of Part D
This study is the prescriber-side view of the program. The Part D drug-spending overview sets the totals; the most-expensive-drugs study explains the brand-vs-generic split that gives oncology its high per-claim cost; the GLP-1 study follows the diabetes-drug surge that is lifting endocrinology and primary care up the cost table; and the by-state study maps the same spending geographically. All are aggregate-only — no individual prescriber is named.
Methodology
Figures come from part_d_by_specialty_mv, a materialized view that sums total_claims and total_drug_cost for each prescriber_specialty in the CMS Medicare Part D Prescribers "by Provider and Drug" 2024 file (snapshot 2026-04-04), across all 182 reporting specialties. Cost per claim is a specialty's total cost divided by its total claims. The primary-care share sums nurse practitioner, internal medicine, and family practice against the program totals in the overview view. Specialty is the prescriber's self-reported type in the CMS taxonomy, attributed to the prescriber who wrote each claim. The exact queries are in the reproducibility block below and trace to the Part D Prescribers dataset. Methodology version: part-d-specialty/v1.
Limitations
- Prescriber-attributed, not service-line. Each claim counts under the specialty of the clinician who wrote it, not the clinical context. Advanced-practice clinicians embedded in specialty practices count under their own specialty.
- Self-reported specialty. Specialty is the CMS taxonomy value the prescriber reports; it usually but not always tracks day-to-day practice.
- Gross cost, not net. Cost is point-of-sale total before confidential manufacturer rebates.
- Cost is not appropriateness. High per-claim cost reflects the drugs a specialty's patients need, not over- or under-prescribing. This study draws no conclusion about clinical decisions.
- Aggregate-only. Every figure is a specialty- or program-level total. No individual prescriber is named, surfaced, or attached to any profile.
Sources
- CMS — Medicare Part D Prescribers by Provider and Drug — the federal public-use file, including the prescriber-specialty field used here.
- CMS — Medicare Part D Prescribers methodology — how prescriber specialty is assigned and how claims are attributed.
- MedPAC — Improving Medicare's payment policies for APRNs and physician assistants — the growth of advanced-practice billing and prescribing in Medicare.
- CMS — National Plan and Provider Enumeration System (NPPES) taxonomy — the provider-taxonomy framework behind the specialty labels.
Frequently asked questions
- Which medical specialty drives the most Medicare Part D drug spending?
- Nurse practitioners, at $37.48 billion in 2024 — more than any physician specialty. Internal medicine ($33.55 billion) and family practice ($29.17 billion) follow. The three primary-care categories together account for about 44% of all Part D drug cost while writing two-thirds of its prescriptions.
- Which specialty writes the most Medicare Part D prescriptions?
- Family practice, with 371 million claims in 2024, ahead of internal medicine (333 million) and nurse practitioners (270 million). Family practice writes the most prescriptions but ranks third in total cost, because at $78.63 per claim its prescriptions are the least expensive of the major specialties.
- Why do nurse practitioners account for so much Part D spending?
- Because there are now more nurse practitioners enrolled in Medicare than any other clinician type, and they practice across primary care where prescription volume is highest. Their per-claim cost, $138.86, sits between internal medicine and family practice; the large total reflects how many of them prescribe, not unusually expensive choices.
- Which specialties have the highest cost per prescription in Part D?
- Cancer specialties. Hematology-oncology averaged about $2,441 per Part D claim in 2024 and medical oncology about $2,394 — sixteen times the program-wide $153 — because they prescribe high-cost specialty and oral chemotherapy drugs. Rheumatology, pulmonary disease, and infectious disease also run far above average.
- Does high prescribing cost mean a specialty is overprescribing?
- No. Cost per claim mostly reflects which drugs a specialty's patients need. Oncology and rheumatology treat conditions that require expensive brand drugs, so their per-claim cost is high by the nature of the disease. The data shows where spending concentrates, not whether any prescription was appropriate.
- How many prescriber specialties are in the Medicare Part D data?
- 182 distinct prescriber specialties report in the 2024 file. They range from primary-care categories writing hundreds of millions of claims to narrow subspecialties writing a few thousand. Specialty is the prescriber's self-reported type in the CMS taxonomy, attributed to the prescriber who wrote each claim.
- Can I reproduce these specialty figures?
- Yes. Every figure comes from the by-specialty materialized view over the CMS Medicare Part D Prescribers 2024 file, which sums cost and claims for each of the 182 prescriber specialties. The exact SQL is in the reproducibility block below and traces to a federal snapshot dated 2026-04-04.
Who uses this data
The source data behind this study is public
Compliance teams, journalists, and researchers work from the same federal source families cited above — queried by NPI or facility identifier through Fonteum’s open dataset pages and API. Every figure traces to a frozen, downloadable snapshot you can reproduce yourself.
Datasets used
Reproducibility
Every claim, reproducible
The SQL
-- Medicare Part D prescribing by specialty, 2024 — reproducible query.
--
-- Source:   CMS Medicare Part D Prescribers, "by Provider and Drug".
-- Snapshot: cms-part-d-prescribers / data year 2024 / CMS release 2026-04-04.
-- Base:     public.cms_part_d_prescribers (~28.0M prescriber × drug rows).
-- Reads:    part_d_by_specialty_mv (one row per prescriber_specialty) +
--           part_d_prescribing_overview_mv (program totals), from
--           supabase/migrations/20260612150000_part_d_prescribing_research_views.sql.
--           The view is GROUP BY prescriber_specialty over the 2024 base rows,
--           summing total_claims and total_drug_cost. Claims are attributed to the
--           prescriber who wrote them, by self-reported CMS specialty.

-- 1. Top prescriber specialties by total drug cost:
SELECT specialty, claims, cost,
       round(cost::numeric / claims, 2) AS cost_per_claim
FROM public.part_d_by_specialty_mv
ORDER BY cost DESC
LIMIT 10;
--  Nurse Practitioner    269,894,701  $37,476,377,293  $138.86  <- highest total cost
--  Internal Medicine     332,609,911  $33,550,092,522  $100.87
--  Family Practice       371,050,213  $29,174,414,333  $78.63   <- most claims, 3rd in cost
--  Hematology-Oncology     7,083,076  $17,288,931,026  $2,440.88 <- highest cost per claim
--  Physician Assistant    95,064,409  $13,558,946,453  $142.63
--  Cardiology             64,689,193  $13,493,559,914  $208.59
--  Pulmonary Disease      13,915,148  $8,399,625,859   $603.63
--  Rheumatology           10,797,149  $8,398,839,294   $777.88
--  Neurology              20,245,985  $7,986,867,428   $394.49
--  Endocrinology          17,972,894  $7,969,575,863   $443.42

-- 2. Specialties ranked by cost PER CLAIM (the cost concentration):
SELECT specialty, claims, cost,
       round(cost::numeric / claims, 2) AS cost_per_claim
FROM public.part_d_by_specialty_mv
WHERE claims >= 1000000          -- exclude tiny subspecialties for a fair per-claim view
ORDER BY cost_per_claim DESC
LIMIT 10;
--  Hematology-Oncology  $2,440.88 ; Medical Oncology $2,394.05 ; Infectious Disease $1,005.30
--  Rheumatology $777.88 ; Pulmonary Disease $603.63 ; Endocrinology $443.42 ...
--  Family Practice $78.63 sits near the bottom — half the $153.24 program average.

-- 3. Primary-care share (NP + Internal Medicine + Family Practice):
WITH pc AS (
  SELECT sum(claims) AS claims, sum(cost) AS cost
  FROM public.part_d_by_specialty_mv
  WHERE specialty IN ('Nurse Practitioner','Internal Medicine','Family Practice')
)
SELECT pc.claims, pc.cost,
       round(100.0 * pc.cost   / ov.total_drug_cost, 1) AS pc_cost_pct,   -- 44.2%
       round(100.0 * pc.claims / ov.total_claims,    1) AS pc_claims_pct  -- 65.8%
FROM pc, public.part_d_prescribing_overview_mv ov;
-- 182 distinct prescriber specialties report in the 2024 file:
SELECT count(*) AS n_specialties FROM public.part_d_by_specialty_mv;   -- 182
The snapshot
| dataset_id | cms-part-d-prescribers |
| snapshot_date | 2026-04-04 |
The JOINs
by_specialty = part_d_by_specialty_mv  -- 182 prescriber specialties, cost + claims
np_cost      = where specialty = 'Nurse Practitioner'  -- $37,476,377,293 on 269,894,701 claims
cost_per_claim = cost / claims  -- Hematology-Oncology 17,288,931,026 / 7,083,076 = $2,440.88
primary_care_cost_share = (NP + Internal Medicine + Family Practice) cost / program cost  -- 100.20B / 226.74B = 44.2%
program totals from part_d_prescribing_overview_mv
The pipeline version
| methodology_version | part-d-specialty/v1 |
Reproduce this
Run the exact query against the frozen 2026-04-04.
Cite this study
Citation-ready for researchers and AI.
Check the chain
The cited snapshot identifies the federal file. Where an attestation is present, its file hash can be re-derived; figures are not individually signed.
cms-part-d-prescribers · 2026-04-04Not suppliedInspect supplied artifact- CARE QUALITY · JUN 2026GLP-1 drugs now cost Medicare Part D $24.57 billion a yearGLP-1 drugs cost Medicare Part D $24.57 billion in 2024 — 10.8% of the entire program's drug spending on just 1.3% of its prescriptions. Ozempic alone, at $12.38 billion, is the second-costliest drug in Part D; Mounjaro and Trulicity push the class past $24 billion.
- FINANCIAL DISTRESS · JUN 2026The Most Expensive Prescription Drugs in Medicare Part DEliquis cost Medicare Part D $19.88 billion in 2024 — the single costliest drug in the program, yet only its 12th most-prescribed. That inversion defines Part D: brand-name drugs are 23.9% of prescriptions but 90.1% of the dollars, while cheap generics carry the volume and almost none of the cost.
- ACCESS · JUN 2026Medicare Part D drug spending by state: where the dollars concentrateCalifornia prescribers drove $21.26 billion of Medicare Part D drug cost in 2024, the most of any state — followed by New York at $18.17 billion, Florida ($16.84 billion), and Texas ($15.75 billion). The four largest states alone account for nearly a third of the program's $226.74 billion in drug spending.
- WORKFORCE · JUN 2026PECOS Lookup: Who Is Enrolled in Medicare? (2026 Data)413,539 nurse practitioner enrollments make NPs the single most common clinician type in Medicare's provider-enrollment file — 13.9% of all 2.98 million PECOS records, nearly triple the largest physician specialty. Together, NPs and physician assistants are one in five enrollments. Advanced-practice providers now anchor the Medicare workforce.
- ACCESS · APR 2026A March spike in Medicare enrollment deactivations thinned provider supply in shortage areasMedicare enrollment deactivations in PECOS ran 28% above the trailing-twelve-month average in March 2026 — and the spike was not uniform. Deactivations in HRSA-designated shortage areas grew 41% against trend, versus 19% elsewhere. The places least able to absorb a departure lost providers fastest.
Federal source citations
Fonteum LLC · June 12, 2026 · All figures trace to the frozen federal-data snapshot cited above.