cms-part-d-prescribers · CMS
cms-part-d-prescribers · CMS
cms-part-d-prescribers · CMS
cms-part-d-prescribers · CMS
Medicare's drug spending has a geography, and at the top it looks exactly as you would expect. In 2024, prescribers in California were attributed $21.26 billion of Medicare Part D drug cost — the most of any state — followed by New York ($18.17 billion), Florida ($16.84 billion), and Texas ($15.75 billion). The largest states spend the most because they have the most people and the most prescribers. The more revealing number is not the total. It is what a single prescription costs Medicare in one state versus another.
The biggest states spend the most — as expected
Total Part D cost tracks population and provider supply almost perfectly. The five largest states by drug spending are the five you would guess:
| State | 2024 Part D cost | Claims | Cost per claim |
|---|---|---|---|
| California | $21.26B | 129,565,592 | $164.11 |
| New York | $18.17B | 95,240,368 | $190.82 |
| Florida | $16.84B | 113,582,265 | $148.25 |
| Texas | $15.75B | 98,638,359 | $159.64 |
| Pennsylvania | $11.13B | 72,980,145 | $152.48 |
Prescribers in just these top four — California, New York, Florida, and Texas — account for $72.0 billion, or 31.8% of all Part D drug cost. Nearly a third of the program runs through four states. That concentration is unremarkable on its own: it is what any nationwide program looks like when you map it by raw dollars, because dollars follow people. The geography only becomes interesting when you control for volume.
Total spending follows population. The more revealing number is what a single prescription costs Medicare in one state versus another.
The real variation is cost per prescription
Divide each state's drug cost by its claim count and a different map appears — one that does not simply restate population.
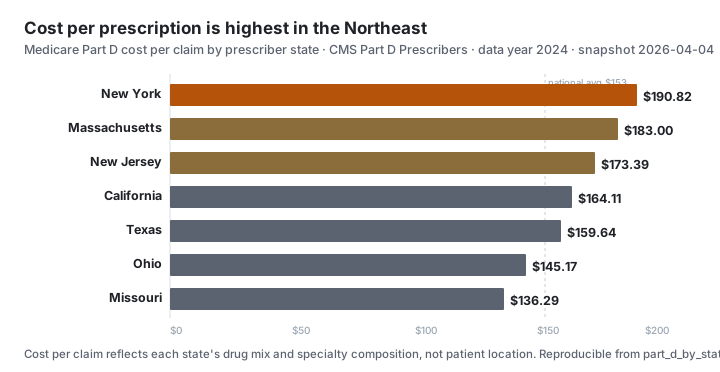
Among the large states the spread runs from about $136 per claim in Missouri to about $191 in New York — a difference of roughly 40%. The Northeast clusters at the top: New York ($190.82), Massachusetts ($183.00), and New Jersey ($173.39) all sit well above the $153 national average. Several Midwestern states — Missouri, Ohio ($145.17), Illinois ($145.31) — run below it. A prescription is not a fixed-cost object; what it costs Medicare depends on the mix of drugs behind it, and that mix varies by state.
The drivers are several and the data does not isolate them. A state with more specialists prescribing brand and specialty drugs will show a higher cost per claim than a state whose prescribing skews to primary-care generics — the same brand-versus-generic split we document in the most-expensive-drugs study. Local practice patterns, the age and health mix of each state's Medicare population, and the share of advanced-practice versus specialist prescribers all feed in. The map shows the result; it does not, by itself, assign a cause.
A prescriber-location map, not a patient map
One caveat governs every number here: the Part D file attributes each claim to the prescriber's practice state, not the patient's home state. For a clinician treating patients who live across a state line — common in dense metro areas — the spending counts where the prescriber practices. State totals describe where prescribing happens, which usually but not always matches where the medicines are taken.This distinction matters most for small or border jurisdictions and least for large states where prescriber and patient geography mostly coincide. It is why this study frames every figure as prescriber-state spending, and why the right reading of the map is "where Medicare's prescriptions are written," not "where Medicare's drug dollars are consumed." The two are close at the scale of California or Texas and can diverge at the scale of the District of Columbia.
How this connects to the rest of Part D
Geography is one cut of a single dataset. The Part D drug-spending overview carries the program totals these state figures sum to; the most-expensive-drugs study explains the brand-versus-generic mix that drives the cost-per-claim spread; the by-specialty study shows the prescriber composition underneath it; and the GLP-1 study follows the diabetes-drug class reshaping spending in every state at once. All are aggregate-only — no individual prescriber is named.
Methodology
Figures come from part_d_by_state_mv, a materialized view that sums total_claims and total_drug_cost for each prescriber_state in the CMS Medicare Part D Prescribers "by Provider and Drug" 2024 file (snapshot 2026-04-04), restricted to rows with a valid two-letter state code (61 jurisdictions: 50 states, DC, and territories). Cost per claim is a state's total cost divided by its total claims. The four-state share sums California, New York, Florida, and Texas against the program totals in the overview view. State is the prescriber's practice location, not the patient's residence. A small amount of spending with no valid state code is excluded from the geographic totals. The exact queries are in the reproducibility block below and trace to the Part D Prescribers dataset. Methodology version: part-d-geography/v1.
Limitations
- Prescriber location, not patient location. Spending is attributed to the prescriber's practice state. It is not a measure of where Medicare beneficiaries live or where drugs are dispensed.
- No per-capita denominator. These are raw totals, not spending per beneficiary. Large states lead because they have more people and prescribers, not because spending is more intense there.
- Cost-per-claim has many drivers. The state spread reflects drug mix, specialty composition, and population health together; the data does not isolate any single cause.
- Gross cost, not net. Cost is point-of-sale total before confidential manufacturer rebates.
- Aggregate-only. Every figure is a state- or program-level total. No individual prescriber is named, surfaced, or attached to any profile.
Sources
- CMS — Medicare Part D Prescribers by Provider and Drug — the federal public-use file, including the prescriber-state field used here.
- CMS — Medicare Part D Prescribers by Geography and Drug — CMS's own geographic companion file, for cross-reference.
- CMS — Medicare Part D Prescribers methodology — how prescriber state is assigned and how claims are attributed.
- KFF — Medicare Part D enrollment and spending — state-level Medicare drug-benefit context.
Frequently asked questions
- Which state has the highest Medicare Part D drug spending?
- California, at $21.26 billion in 2024 — the most of any state. New York ($18.17 billion), Florida ($16.84 billion), Texas ($15.75 billion), and Pennsylvania ($11.13 billion) follow. The ranking closely tracks state population and the number of Medicare prescribers, so the largest states lead.
- How concentrated is Medicare Part D spending geographically?
- Highly. Prescribers in just four states — California, New York, Florida, and Texas — account for 31.8% of all Part D drug cost, nearly a third of the $226.74 billion program. Spending scales with population and provider supply, so it concentrates in the most populous states.
- Why does cost per prescription differ by state?
- Cost per Part D claim ranged from about $136 in Missouri to about $191 in New York in 2024. The spread reflects differences in the drug mix prescribed — more brand and specialty drugs in some states — along with prescriber specialty composition and local practice patterns, not a single cause.
- Are these figures based on where patients live or where doctors practice?
- Where the prescriber practices. The Part D file attributes each claim to the prescriber's practice state, not the patient's home state. A state's total reflects the prescribing done by clinicians located there, which usually but not always matches where the medicines are taken.
- Which states have the highest Part D cost per prescription?
- Among the large states, the Northeast leads: New York at $190.82 per claim, Massachusetts at $183.00, and New Jersey at $173.39, all above the $153 national average. Lower-cost-per-claim states include Missouri ($136.29) and Ohio ($145.17).
- How many states report Medicare Part D prescribing?
- 61 states and territories appear in the 2024 prescriber file with a valid two-letter code. That includes all 50 states, the District of Columbia, and U.S. territories such as Puerto Rico. A small amount of spending with no valid state code is excluded from the geographic totals.
- Can I reproduce these state figures?
- Yes. Every figure comes from the by-state materialized view over the CMS Medicare Part D Prescribers 2024 file, which sums cost and claims for each prescriber state. The exact SQL is in the reproducibility block below and traces to a federal snapshot dated 2026-04-04.
Who uses this data
The source data behind this study is public
Compliance teams, journalists, and researchers work from the same federal source families cited above — queried by NPI or facility identifier through Fonteum’s open dataset pages and API. Every figure traces to a frozen, downloadable snapshot you can reproduce yourself.
Datasets used
Reproducibility
Every claim, reproducible
The SQL
-- Medicare Part D prescribing by state, 2024 — reproducible query.
--
-- Source:   CMS Medicare Part D Prescribers, "by Provider and Drug".
-- Snapshot: cms-part-d-prescribers / data year 2024 / CMS release 2026-04-04.
-- Base:     public.cms_part_d_prescribers (~28.0M prescriber × drug rows).
-- Reads:    part_d_by_state_mv (one row per prescriber_state) +
--           part_d_prescribing_overview_mv (program totals), from
--           supabase/migrations/20260612150000_part_d_prescribing_research_views.sql.
--           The view is GROUP BY prescriber_state over the 2024 base rows where
--           length(prescriber_state) = 2, summing total_claims and total_drug_cost.
--           State is the PRESCRIBER'S practice location, not the patient's home.

-- 1. Top states by total drug cost:
SELECT state, claims, cost,
       round(cost::numeric / claims, 2) AS cost_per_claim
FROM public.part_d_by_state_mv
ORDER BY cost DESC
LIMIT 10;
--  CA  129,565,592  $21,262,400,165  $164.11  <- highest total
--  NY   95,240,368  $18,174,131,281  $190.82  <- highest cost/claim among large states
--  FL  113,582,265  $16,838,937,918  $148.25
--  TX   98,638,359  $15,746,441,934  $159.64
--  PA   72,980,145  $11,128,347,140  $152.48
--  OH   62,294,899  $9,043,071,424   $145.17
--  NC   52,430,568  $8,138,215,348   $155.22
--  MI   49,623,865  $7,821,347,989   $157.61
--  IL   51,867,241  $7,536,982,736   $145.31
--  GA   47,568,589  $7,304,129,570   $153.55

-- 2. Four-state concentration (CA + NY + FL + TX):
WITH top4 AS (
  SELECT sum(cost) AS cost
  FROM public.part_d_by_state_mv
  WHERE state IN ('CA','NY','FL','TX')
)
SELECT top4.cost,
       round(100.0 * top4.cost / ov.total_drug_cost, 1) AS top4_cost_pct  -- 31.8%
FROM top4, public.part_d_prescribing_overview_mv ov;

-- 3. Cost-per-claim spread across large states (the figure):
SELECT state, round(cost::numeric / claims, 2) AS cost_per_claim
FROM public.part_d_by_state_mv
WHERE state IN ('NY','MA','NJ','CA','TX','OH','MO')
ORDER BY cost_per_claim DESC;
--  NY $190.82 ; MA $183.00 ; NJ $173.39 ; CA $164.11 ; TX $159.64 ; OH $145.17 ; MO $136.29
--  Program average = $153.24 (overview_mv.total_drug_cost / total_claims).

-- 61 reporting jurisdictions (50 states + DC + territories with a 2-letter code):
SELECT count(*) AS n_jurisdictions FROM public.part_d_by_state_mv;   -- 61
The snapshot
| dataset_id | cms-part-d-prescribers |
| snapshot_date | 2026-04-04 |
The JOINs
by_state = part_d_by_state_mv  -- 61 jurisdictions, prescriber state, cost + claims
ca_cost  = where state = 'CA'  -- $21,262,400,165 on 129,565,592 claims
cost_per_claim = cost / claims  -- NY 18,174,131,281 / 95,240,368 = $190.82 ; MO = $136.29
top4_share = (CA + NY + FL + TX) cost / program cost  -- 72.02B / 226.74B = 31.8%
program totals from part_d_prescribing_overview_mv
The pipeline version
| methodology_version | part-d-geography/v1 |
Reproduce this
Run the exact query against the frozen 2026-04-04.
Cite this study
Citation-ready for researchers and AI.
Check the chain
The cited snapshot identifies the federal file. Where an attestation is present, its file hash can be re-derived; figures are not individually signed.
cms-part-d-prescribers · 2026-04-04Not suppliedInspect supplied artifact- CARE QUALITY · JUN 2026GLP-1 drugs now cost Medicare Part D $24.57 billion a yearGLP-1 drugs cost Medicare Part D $24.57 billion in 2024 — 10.8% of the entire program's drug spending on just 1.3% of its prescriptions. Ozempic alone, at $12.38 billion, is the second-costliest drug in Part D; Mounjaro and Trulicity push the class past $24 billion.
- FINANCIAL DISTRESS · JUN 2026The Most Expensive Prescription Drugs in Medicare Part DEliquis cost Medicare Part D $19.88 billion in 2024 — the single costliest drug in the program, yet only its 12th most-prescribed. That inversion defines Part D: brand-name drugs are 23.9% of prescriptions but 90.1% of the dollars, while cheap generics carry the volume and almost none of the cost.
- WORKFORCE · JUN 2026Who prescribes Medicare's drug spending? Nurse practitioners now leadNurse practitioners drove $37.48 billion of Medicare Part D drug cost in 2024 — more than any other specialty, including internal medicine and cardiology. But the steepest bills come from oncology: hematology-oncologists averaged $2,441 per prescription, sixteen times the program-wide $153, on a fraction of the claims.
- WORKFORCE · JUN 2026PECOS Lookup: Who Is Enrolled in Medicare? (2026 Data)413,539 nurse practitioner enrollments make NPs the single most common clinician type in Medicare's provider-enrollment file — 13.9% of all 2.98 million PECOS records, nearly triple the largest physician specialty. Together, NPs and physician assistants are one in five enrollments. Advanced-practice providers now anchor the Medicare workforce.
- ACCESS · APR 2026A March spike in Medicare enrollment deactivations thinned provider supply in shortage areasMedicare enrollment deactivations in PECOS ran 28% above the trailing-twelve-month average in March 2026 — and the spike was not uniform. Deactivations in HRSA-designated shortage areas grew 41% against trend, versus 19% elsewhere. The places least able to absorb a departure lost providers fastest.
Federal source citations
Fonteum LLC · June 12, 2026 · All figures trace to the frozen federal-data snapshot cited above.