Hospital Cost Reports (HCRIS) Data
Fonteum structures the CMS Healthcare Cost Report Information System — the annual financial disclosure dataset for 6,000+ Medicare-participating hospitals — into a query-ready facility-summary schema with dataset provenance and source-line locators where available. Revenue, operating margin, cost per discharge, payer mix, charity care, and FTE staffing, annually from FY2015.
What is CMS HCRIS?
Every hospital that participates in Medicare must submit an annual cost report (Form CMS-2552) to CMS within five months of its fiscal year end. The cost report is a detailed financial disclosure: total revenues by payer (Medicare, Medicaid, commercial, self-pay, charity care), total costs broken out by cost center, staffing in full-time equivalents, bed counts, and patient-day volumes by payer category. CMS aggregates these filings into HCRIS — the Healthcare Cost Report Information System — and publishes the underlying data files annually.
HCRIS is the definitive federal source for hospital financial performance that is publicly available. It covers approximately 6,000+ Medicare-participating hospitals, including short-term acute care, critical access hospitals, psychiatric facilities, and long-term acute care hospitals. The data runs from the early 1990s; Fonteum's structured layer starts at FY2015 and adds annual increments as CMS publishes each year's final files.
Limitation: cost reports are filed on a rolling basis and appear in HCRIS 6–18 months after a facility's fiscal year ends. The most recent fiscal year in HCRIS will have incomplete coverage until roughly 18 months post-period. Fonteum documents this coverage gap per snapshot in the provenance metadata so analysts know which facilities and fiscal years are represented.
What Fonteum structures from the raw cost reports
The raw HCRIS files (RPT, NMRC, ALPHA, RPT_NME) require significant join logic to produce a facility-year analytical dataset. Fonteum handles this parse pipeline and delivers the hcris_facility_summary table with:
- One row per facility per fiscal year — normalized from the multi-file HCRIS format into a flat analytical schema.
- Derived financial metrics: operating_margin (net_patient_revenue minus total_operating_expenses, divided by total_patient_revenue), cost_per_discharge, payer mix percentages, charity care as a share of total cost.
- Source-line locators where available — parsed CMS-2552 values can carry source_worksheet and source_line; derived, suppressed, and null values may not map to one line item.
- Dataset provenance metadata records the CMS source, release, methodology, and known limitations; optional citation fields are present only when the source supplies them.
- Cross-reference to Care Compare quality ratings on facility CCN, linking financial performance to quality star ratings for the same facility.
Use cases for HCRIS hospital financial data
Acquiring a hospital or health system requires benchmarking the target's operating margin, payer mix, and cost structure against regional and national peers. HCRIS is the only freely available source for this data. Fonteum's facility-year time series and peer-filtering API reduce the data assembly phase of hospital M&A diligence.
Commercial payers and ACOs need to understand hospital cost structure — cost per discharge, payer mix, Medicare-to-commercial rate ratios — before negotiating contracts or evaluating network adequacy. HCRIS provides the cost basis; Fonteum structures it at the facility level with a query API.
Research on hospital financial distress, safety-net hospital margins, and rural hospital closure risk relies on HCRIS as the primary federal data source. Fonteum's margin-gap research (see /research/hospital-margin-gap) uses this dataset to document the disparity between large system margins and independent hospital margins.
Hospital Margin Gap research study → · Hospital Margin Gap and Distress study →
Frequently asked questions
- What is HCRIS and what financial data does it contain?
- The Healthcare Cost Report Information System (HCRIS) is the CMS database of annual cost reports that hospitals, skilled nursing facilities, home health agencies, and other Medicare-participating providers are required to submit. The hospital cost report (Form CMS-2552) is the most widely used subset. It contains a facility's total patient revenue, net patient revenue, total operating expenses, Medicare and Medicaid payment amounts, payer mix (commercial, Medicare, Medicaid, self-pay, charity care), cost per discharge by DRG type, full-time-equivalent staffing, and total assets. Fonteum's HCRIS layer covers the hospital subset: approximately 6,000+ facilities with annual data going back to fiscal year 2015.
- How does Fonteum's HCRIS data differ from downloading the raw CMS cost reports?
- CMS publishes HCRIS as a set of RPT, NMRC, ALPHA, and RPT_NME flat files that require significant parsing work to join into a usable analytical dataset. The raw files have no API, no schema versioning, and report fiscal-year data on a rolling basis as facilities file their annual cost reports (often 6–18 months after fiscal year end). Fonteum processes the files into a facility-summary schema and exposes available dataset and source-line metadata. Derived, suppressed, or missing values may not have a complete provenance tuple.
- What financial metrics does Fonteum extract from hospital cost reports?
- Fonteum's hcris_facility_summary schema covers: total_patient_revenue, net_patient_revenue, total_operating_expenses, operating_income, operating_margin (derived), cost_per_discharge, medicare_days, medicaid_days, charity_care_cost, bad_debt, ftes (total staffing), total_beds, and fiscal_year_end_date. Financial fields are nominal USD. Source-worksheet and source-line locators appear where the parsed CMS-2552 input supplies them; derived or null values may not map to a single line item.
- How does HCRIS data support M&A diligence in healthcare?
- Hospital and health system M&A diligence requires financial performance benchmarks, payer mix analysis, and margin trajectory data for the target facility and comparable peers. HCRIS is the only source of annual audited financial data for Medicare-participating hospitals that is publicly available without a vendor contract. Fonteum structures it for diligence workflows: facility-year time series, peer-group filtering by bed count and CMS region, and cross-reference to Care Compare quality ratings and CMS provider counts. The audit-pack export includes the HCRIS facility summary table pre-joined for health system diligence use cases.
- How current is the HCRIS data and how are filing lags handled?
- HCRIS is an annual dataset, and facility reports arrive on a rolling basis. Fonteum exposes loaded HCRIS rows with the dates present on the response; this page does not claim that the latest CMS quarterly release is loaded or that expected-filer coverage is complete.
Access the HCRIS financial data layer
The Audit Pack includes an HCRIS facility-summary export for the most recent three fiscal years, joined to Care Compare quality ratings. For custom fiscal-year ranges, peer-group filters, or payer mix analytics, contact the data engineering team.
Most US hospitals lose money on operations
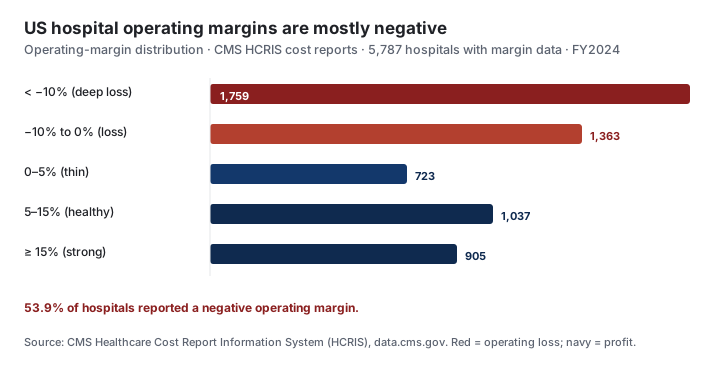
Across hospitals in the latest filed cost reports, the median operating margin was and 53.9% reported a negative operating margin. Yet the median total margin was a positive 6.02% — the gap shows how dependent hospitals are on non-operating income such as investments and grants. Hospitals also absorbed in charity-care cost.
Operating-margin distribution
The losses are not marginal: 1,759 hospitals reported an operating margin below −10%, a deeper hole than a thin profit can fill. The distribution below covers the 5,787 hospitals with a reported operating margin.
Related Fonteum data: the hospital margin-gap study tracks the operating-to-total-margin divergence over time, the ownership records link financials to chains, and the source catalog lists every federal feed.
Methodology
Margins are derived from the CMS HCRIS hospital cost-report worksheets — not from an aggregator. The pipeline runs in five stages: (1) source acquisition from data.cms.gov, (2) entity resolution on the CCN, (3) worksheet line-item extraction (net patient revenue, operating expense, total margin, charity care), (4) quality checks against published CMS counts, and (5) recording available snapshot metadata. Displayed values identify the CMS source and fiscal period; attestation coverage is snapshot-specific, not a signature on each value.
These figures show the source and fiscal-period metadata available to this page. The optional schema is documented on the data sources reference.
Source comparison: grain, cadence, and access
The same CMS cost reports underlie the $30K commercial hospital-finance products. Fonteum publishes the facility-level figures free, with provenance.
| Source | Data grain | Cadence | Access | Provenance |
|---|---|---|---|---|
| Fonteum | Facility (CCN) financials | No platform cadence promised; inspect the loaded snapshot date | API + bulk, free base | Nullable source metadata |
| CMS HCRIS download | Facility (raw worksheets) | Quarterly | Free flat files, no API | None (raw file) |
| Definitive Hospital Performance Manager | Facility / system | Annual | Paid (~$30K) | None |
| AHA Annual Survey | Facility (survey) | Annual | Paid | None |
Sources
- Healthcare Cost Report Information System (HCRIS) — Centers for Medicare & Medicaid Services (CMS), Quarterly. Primary source ↗ · Archive ↗
Used for: Hospital revenue, expense, margin, charity care, and bed/discharge fields per CCN. - CMS Cost Reports — Hospital Form (CMS-2552) filings — Centers for Medicare & Medicaid Services (CMS), Quarterly. Primary source ↗ · Archive ↗
Used for: The HOSP10 worksheet source for the margin and charity-care line items. - Nursing Home — Provider Information — Centers for Medicare & Medicaid Services (CMS), Monthly. Primary source ↗ · Archive ↗
Used for: CCN identity backbone joined to cost-report financials.
Data last updated: 2025-09-30 · Reviewed by Jennifer Montecillo, MD · June 2026. Non-practicing medical reviewer.