cms-hospital-compare · CMS
cms-hospital-compare · CMS
cms-hospital-compare · CMS
cms-hospital-compare · CMS
Every nonprofit hospital in America operates under a bargain: it pays no federal income tax, no state corporate tax, and usually no local property tax, and in exchange it is supposed to deliver community benefit — care and services that justify the public subsidy. The most visible part of that bargain is charity care: free or discounted treatment for patients who cannot pay. The federal cost reports let us measure how much of it actually gets delivered, by whom, and the answer cuts against the intuition the tax exemption is built on: the nonprofit hospitals that are exempt precisely because of community benefit deliver the smallest share of their revenue as charity care of any kind of hospital.
What we measured
Every Medicare-participating hospital files an annual cost report (CMS form 2552-10) into the Healthcare Cost Report Information System (HCRIS). Worksheet S-10 of that report carries two distinct uncompensated-care lines: charity care cost — care given free or discounted under the hospital's financial assistance policy — and bad debt expense — billed care the hospital expected to collect and never did. We read both, at cost, for every hospital in the 2026-05-24 HCRIS snapshot: 6,019 hospitals, of which 4,135 reported positive charity care.
The national totals:
- $27.68 billion in charity care across the 4,135 reporting hospitals.
- $12.38 billion in bad debt (4,393 hospitals reporting).
- The average reporting hospital provided $6.7 million of charity care — but the median was just $1.5 million. The gap between the two is the first signal that the dollars are heavily concentrated, not evenly spread.
Those are the raw numbers. The story is in how they divide.
The nonprofit paradox: who gives the least
To see who carries the charity-care load, we joined every hospital's cost report to its ownership type — nonprofit, for-profit (proprietary), or government — using the CCN as the join key. Then we measured charity care as a share of each ownership class's net patient revenue, the apples-to-apples way to compare a $2 billion academic medical center with a $40 million rural hospital.
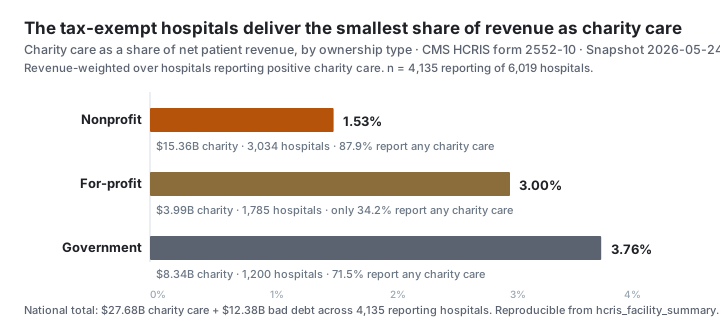
- Nonprofit hospitals — 3,034 facilities — devoted 1.53% of patient revenue to charity care ($15.36 billion). That is the lowest share of the three ownership types.
- For-profit hospitals — 1,785 facilities — came in at 3.00% ($3.99 billion).
- Government hospitals — 1,200 facilities — devoted 3.76% ($8.34 billion), more than double the nonprofit rate.
The hospitals that exist specifically to serve the public — government and safety-net facilities — and even the hospitals that exist to make money give a larger share of their revenue as free care than the tax-exempt charities do. This is the empirical core of a debate that has run through the Senate Finance Committee and the GAO for a decade: nonprofit hospitals receive a tax exemption that KFF valued at roughly $28 billion in 2020 — and as a class, they convert a smaller slice of their revenue into charity care than either of the other two ownership models.
Nonprofit hospitals are exempt from tax in exchange for community benefit. In the cost reports, they deliver the smallest share of their revenue as charity care of any kind of hospital — and the law sets no floor that says they must do more.
For-profit hospitals mostly don't report it at all
The for-profit number deserves an asterisk that, if anything, sharpens the point. Among the 1,785 for-profit hospitals, only 34.2% reported any positive charity care at all — against 87.9% of nonprofits and 71.5% of government hospitals. So the 3.00% for-profit ratio is measured over the minority of for-profit hospitals that report charity care; most for-profit facilities record little or none, routing uncompensated care through bad debt and aggressive collection instead.
That is the honest reading: nonprofits are the most consistent providers of charity care — almost all of them deliver some — but the share of revenue they commit to it is still the smallest. Consistency and generosity are different things, and the cost reports separate them.
Charity care is wildly concentrated
The gap between the $6.7 million average and the $1.5 million median is not noise — it is the shape of the whole system. Charity care in America is delivered by a small set of very large hospitals:
- The top 10% of reporting hospitals deliver 65.4% of all charity care dollars.
- The top 50 hospitals alone account for 26.5% of the national total.
- The entire bottom half of reporting hospitals — over 2,000 facilities — together provide just 3.1%.
Within the nonprofit class, the concentration shows up as a long tail of low-charity hospitals. Of the 1,064 large nonprofit hospitals with more than $250 million in patient revenue that report charity care, 500 — nearly half — deliver charity care worth under 1% of their own revenue. These are not small rural facilities running on empty; they are large, well-capitalized tax-exempt systems whose charity-care commitment, measured against their own revenue, is a fraction of a percent.
501(r): a tax exemption with no charity floor
Why can a billion-dollar tax-exempt hospital provide charity care worth less than 1% of its revenue and keep its exemption? Because federal law does not require otherwise.
Tax exemption for nonprofit hospitals rests on the community-benefit standard set by IRS Revenue Ruling 69-545 in 1969, which replaced an older rule that had required hospitals to actually provide free or below-cost care. Under the 1969 standard, charity care became just one favorable factor among many — an open emergency room, a community board, treating Medicaid patients — and no specific amount was mandated.
The Affordable Care Act added Section 501(r) in 2010, with four operational requirements finalized in Treasury regulations in 2014: conduct a community health needs assessment every three years; maintain a written financial assistance policy; limit what financial-assistance-eligible patients are charged; and curb extraordinary collection actions. Crucially, §501(r) governs how a hospital runs its charity-care process — not how much charity care it must provide. It sets no minimum dollar amount and no minimum percentage.
That gap is the policy story. The GAO, in its 2020 report Tax Administration: Opportunities Exist to Improve Oversight of Hospitals' Tax-Exempt Status (GAO-20-679), found the law unclear about what community benefit hospitals must deliver and recommended that Congress consider specifying it in the tax code. Senate Finance Committee members have pressed the same point for years. The cost reports above are the measurement layer underneath that debate: they show, hospital by hospital, exactly how much free care the exemption is buying.
Charity care is not the whole community-benefit picture
One honest caveat. Charity care is the most legible piece of community benefit, but it is not the only piece. On IRS Form 990 Schedule H, tax-exempt hospitals also report unreimbursed Medicaid costs, health-professions education, research, and subsidized services — and those categories together are far larger than charity care alone. A nonprofit hospital with a low charity-care ratio may carry a heavy Medicaid shortfall that the cost report's charity line does not capture.
What the HCRIS data establishes is narrow and solid: on the single, comparable, audited-by-CMS charity-care line, the tax-exempt class delivers the smallest share of revenue. Whether the rest of the community-benefit ledger closes that gap is a separate question — and one that Schedule H, not Worksheet S-10, is built to answer.
How this differs from our other hospital-finance studies
This study uses the same HCRIS source as two companion analyses but asks a different question:
- Our rural hospital closures study is the closure-risk lens — operating margins and which hospitals are most likely to go dark.
- Our hospitals running out of cash study is the liquidity lens — days of cash on hand.
This one is the community-benefit lens: not whether a hospital makes money or can survive a shock, but how much of its revenue it returns to patients who cannot pay — and how that tracks the tax bargain nonprofit hospitals operate under.
Methodology
Charity care cost and bad debt expense are the HCRIS Worksheet S-10 fields charity_care_cost and bad_debt_expense on hcris_facility_summary, reported at cost. "Reporting" means charity_care_cost > 0. Ownership type comes from hospital_directory.ownership_type (nonprofit / proprietary / government), joined on the CCN. Charity-care-share-of-revenue is revenue-weighted — the sum of charity care divided by the sum of net patient revenue across reporting hospitals in each ownership class — so a few large hospitals do not distort the class average the way an unweighted mean of ratios would. The snapshot is the 2026-05-24 HCRIS release (form CMS-2552-10, fiscal years ending mostly 2023–2024). The exact queries are in the reproducibility block below and on the HCRIS dataset page. Methodology version: hospital-charity-care/v1.
Limitations
- Charity care ≠ all community benefit. Worksheet S-10 captures charity care and bad debt, not the full community-benefit ledger (Medicaid shortfall, education, research, subsidized services) that nonprofit hospitals report on IRS Form 990 Schedule H. A low charity-care ratio is not, by itself, proof of a thin community contribution.
- Reporting-rate differences. For-profit hospitals report positive charity care far less often (34.2%) than nonprofits (87.9%), so the for-profit ratio is computed over a self-selected minority. We flag this in the text rather than papering over it.
- Self-reported, not audited here. HCRIS is hospital-self-reported cost-report data. CMS audits Worksheet S-10 for the disproportionate-share payment formula, but Fonteum does not independently rate, rank, or pass judgment on any individual hospital's charity-care behavior.
- Cost-report lag. Cost reports lag operations by 12–18 months and reflect a hospital's most recent filed fiscal year, not the current quarter.
- Ownership classification. Ownership type is the CMS directory classification at the snapshot date; a hospital that changed hands recently may be filed under its prior owner.
Sources
- CMS HCRIS Hospital Cost Reports (form CMS-2552-10) — the primary federal source for charity care and bad debt (Worksheet S-10).
- CMS — Reviews of Cost Report Worksheet S-10 (Uncompensated Care) — how CMS defines and audits the charity-care and bad-debt lines.
- IRS — Requirements for 501(c)(3) hospitals under the ACA (Section 501(r)) — the four §501(r) requirements, and the absence of a charity-care floor.
- Federal Register — Additional Requirements for Charitable Hospitals (final §501(r) regulations, 2014) — the Treasury final rule.
- IRS — Charitable hospitals: general requirements for exemption (Rev. Rul. 69-545) — the community-benefit standard.
- IRS — Instructions for Schedule H (Form 990) — what tax-exempt hospitals report as community benefit, including charity care at cost.
- KFF — The Estimated Value of Tax Exemption for Nonprofit Hospitals Was About $28 Billion in 2020 — the exemption-value benchmark.
Frequently asked questions
- What is hospital charity care?
- Charity care is medical care a hospital provides free or at a discount to patients who cannot afford to pay, under the hospital's written financial assistance policy, with no expectation of payment. On the federal cost report it is recorded at cost — what the care cost the hospital, not what it would have been billed.
- How much charity care do US hospitals provide?
- Across the 6,019 Medicare hospitals in the 2026 HCRIS cost-report snapshot, 4,135 reported positive charity care totaling $27.68 billion, plus $12.38 billion in bad debt. The average reporting hospital provided $6.7 million, but the median was $1.5 million — most of the dollars come from a small number of very large hospitals.
- Do nonprofit hospitals provide more charity care than for-profit hospitals?
- Not as a share of revenue. Tax-exempt nonprofit hospitals delivered charity care worth 1.53% of their patient revenue — below for-profit hospitals at 3.00% and government hospitals at 3.76%. Nonprofits report charity care far more consistently (87.9% of them do), but the share of revenue they devote to it is the smallest of the three ownership types.
- What is the difference between charity care and bad debt?
- Charity care is care given free or discounted to patients the hospital has determined cannot pay, under its financial assistance policy. Bad debt is billed care the hospital expected to collect but never did — the patient neither paid nor qualified for assistance. The two are separate lines on the cost report; together they make up uncompensated care.
- Are nonprofit hospitals required to provide a minimum amount of charity care?
- No. Section 501(r) of the tax code, added by the Affordable Care Act, requires tax-exempt hospitals to run a financial assistance policy, limit charges, and curb aggressive collections — but it sets no minimum dollar amount or percentage of charity care a hospital must provide. The community-benefit standard is judged on facts and circumstances, not a floor.
- Can I reproduce these numbers?
- Yes. Every figure aggregates the 6,019-row hcris_facility_summary table from the frozen 2026-05-24 HCRIS snapshot, joined to hospital_directory for ownership type on the CCN key. Charity care and bad debt come from Worksheet S-10 of the cost report. The exact SQL is published in the reproducibility block below, and the dataset is downloadable.
Who uses this data
The source data behind this study is public
Compliance teams, journalists, and researchers work from the same federal source families cited above — queried by NPI or facility identifier through Fonteum’s open dataset pages and API. Every figure traces to a frozen, downloadable snapshot you can reproduce yourself.
Datasets used
Reproducibility
Every claim, reproducible
The SQL
-- Hospital Charity Care × Community Benefit — fully reproducible query.
--
-- Source:   CMS HCRIS Hospital Cost Reports (form CMS-2552-10), Worksheet S-10
--           uncompensated-care lines (charity care cost, bad debt expense),
--           FY2024 vintage.
-- Snapshot: cms-hcris-hospital-2552-10 / 2026-05-24
-- Archive:  https://downloads.cms.gov/FILES/HCRIS/HOSP10FY2024.ZIP
-- SHA-256:  e9552da36dcdcf904c5c4d35ffffe843af5b38afac196ac9db7db101bc8a96a0
-- Tables:   public.hcris_facility_summary  (public, read-only)
--           public.hospital_directory      (CCN-keyed ownership_type, public, read-only)
--
-- Charity care = care provided free or discounted under a hospital's financial
-- assistance policy (distinct from bad debt = billed care that went uncollected).
-- "Reporting" = charity_care_cost > 0. Ownership-type ratios are revenue-weighted
-- (sum of charity / sum of net patient revenue) over reporting hospitals.

-- Audit observation: 2026-07-14. Source snapshot remains 2026-05-24.
-- audit-claim: national-charity-summary
SELECT
  count(*)                                                         AS hospitals_total,        -- 6,019
  count(*) FILTER (WHERE charity_care_cost > 0)                    AS reporting_charity,       -- 4,135
  count(*) FILTER (WHERE bad_debt_expense  > 0)                    AS reporting_bad_debt,      -- 4,393
  round(sum(charity_care_cost) FILTER (WHERE charity_care_cost > 0)/1e9, 2) AS charity_billion,-- 27.68
  round(sum(bad_debt_expense)  FILTER (WHERE bad_debt_expense  > 0)/1e9, 2) AS bad_debt_billion,-- 12.38
  round(avg(charity_care_cost) FILTER (WHERE charity_care_cost > 0)/1e6, 2) AS avg_charity_mn, -- 6.70
  round((percentile_cont(0.5) WITHIN GROUP (ORDER BY charity_care_cost)
         FILTER (WHERE charity_care_cost > 0)/1e6)::numeric, 2)    AS median_charity_mn        -- 1.47
FROM public.hcris_facility_summary;

-- audit-claim: charity-by-ownership
--    ownership type. The tax-exempt nonprofit class gives the smallest share.
WITH j AS (
  SELECT d.ownership_type AS ot,
         h.charity_care_cost AS cc,
         h.net_patient_revenue AS npr
  FROM public.hcris_facility_summary h
  JOIN public.hospital_directory d ON d.ccn = h.ccn
)
SELECT
  ot,
  count(*)                                          AS facilities,            -- nonprofit 3,034 · proprietary 1,785 · government 1,200
  count(*) FILTER (WHERE cc > 0)                    AS reporting_charity,     -- 2,667 · 610 · 858
  round(100.0 * count(*) FILTER (WHERE cc > 0)
        / count(*), 1)                              AS report_rate_pct,      -- 87.9 · 34.2 · 71.5
  round(sum(cc) FILTER (WHERE cc > 0)/1e9, 2)       AS charity_billion,      -- 15.36 · 3.99 · 8.34
  round(100.0 * sum(cc) FILTER (WHERE cc > 0 AND npr > 0)
        / NULLIF(sum(npr) FILTER (WHERE cc > 0 AND npr > 0), 0), 2)
                                                    AS charity_pct_of_npr    -- 1.53 · 3.00 · 3.76
FROM j
GROUP BY ot
ORDER BY charity_pct_of_npr;

-- audit-claim: charity-concentration
WITH r AS (
  SELECT charity_care_cost AS cc,
         row_number() OVER (ORDER BY charity_care_cost DESC) AS rn,
         count(*)        OVER ()                              AS n,
         sum(charity_care_cost) OVER ()                       AS tot
  FROM public.hcris_facility_summary WHERE charity_care_cost > 0
)
SELECT
  round(100.0 * sum(cc) FILTER (WHERE rn <= 0.10 * n)/max(tot), 1) AS top_decile_share,   -- 65.4
  round(100.0 * sum(cc) FILTER (WHERE rn <= 50)/max(tot), 1)       AS top_50_share,       -- 26.5
  round(100.0 * sum(cc) FILTER (WHERE rn >  0.50 * n)/max(tot), 1) AS bottom_half_share   -- 3.1
FROM r;

-- audit-claim: large-nonprofit-under-one-percent
--    below 1% of revenue — the cohort the community-benefit debate centers on.
SELECT
  count(*) FILTER (WHERE h.charity_care_cost > 0) AS big_nonprofit_reporting,
  count(*) FILTER (
    WHERE h.charity_care_cost > 0
      AND h.charity_care_cost / h.net_patient_revenue < 0.01
  ) AS big_nonprofit_under_1pct
FROM public.hcris_facility_summary h
JOIN public.hospital_directory d ON d.ccn = h.ccn
WHERE d.ownership_type = 'nonprofit' AND h.net_patient_revenue > 250e6;
The snapshot
| dataset_id | cms-hcris-hospital-2552-10 |
| snapshot_date | 2026-05-24 |
| sha256 | e9552da36dcdcf904c5c4d35ffffe843af5b38afac196ac9db7db101bc8a96a0 |
The JOINs
charity_care_cost   = hcris_facility_summary.charity_care_cost  -- Worksheet S-10 charity-care cost at cost
bad_debt_expense    = hcris_facility_summary.bad_debt_expense   -- Worksheet S-10 non-Medicare bad debt
net_patient_revenue = hcris_facility_summary.net_patient_revenue
ownership_type      = hospital_directory.ownership_type  ⨝ ON hcris_facility_summary.ccn = hospital_directory.ccn
charity_pct_of_npr  = sum(charity_care_cost) / sum(net_patient_revenue) × 100  -- revenue-weighted, over reporting hospitals
The pipeline version
| methodology_version | hospital-charity-care/v1 |
Reproduce this
Run the exact query against the frozen 2026-05-24.
Cite this study
Citation-ready for researchers and AI.
Check the chain
The cited snapshot identifies the federal file. Where an attestation is present, its file hash can be re-derived; figures are not individually signed.
cms-hcris-hospital-2552-10 · 2026-05-24SHA-256 e9552da3…96a0Inspect supplied artifact- ACCESS · JUN 2026Healthcare Deserts: Where Care Disappears in America (2026)Two-thirds of America's active health-care shortage areas are rural: 13,999 of the 21,133 designated Health Professional Shortage Areas — 66.2% — sit in rural communities, against 6,069 non-rural ones. The rural skew holds across primary care (66.0%), mental health (65.3%), and dental health (67.4%) alike, spanning 25,281 federal designations in 60 jurisdictions.
- FINANCIAL DISTRESS · JUN 2026Rural hospital closures, by the numbers: which hospitals are most at riskRural Critical Access Hospitals — the small facilities at the center of the closure crisis — run a 50.4% financial-distress rate, against 39.2% for urban hospitals, across 6,019 Medicare hospitals in the federal HCRIS cost reports. Their average operating margin is −8.93%, and 682 are losing money on patient care.
- FINANCIAL DISTRESS · JUN 2026Hospitals at Risk of Closing? The Days-Cash-on-Hand SignalFederal HCRIS cost reports let us compute days cash on hand for 5,459 hospitals, but facility-level figures are distorted by system-level cash pooling — so the raw '2,800 hospitals under 30 days' headline is mostly noise. The defensible signal is narrower: 690 hospitals that report thin cash and also run an operating loss.
- FINANCIAL DISTRESS · JUN 2026The OIG exclusion list, explained: who gets barred from Medicare, and whyThe OIG List of Excluded Individuals and Entities (LEIE) holds 68,055 active exclusions spanning 1977–2026. The most common reason to be barred from Medicare is not fraud — it is losing a state license: §1128(b)(4) license actions are 41% of the list. And only 10.3% of records carry an NPI, so the list is mostly non-clinicians.
- ACCESS · APR 2026A March spike in Medicare enrollment deactivations thinned provider supply in shortage areasMedicare enrollment deactivations in PECOS ran 28% above the trailing-twelve-month average in March 2026 — and the spike was not uniform. Deactivations in HRSA-designated shortage areas grew 41% against trend, versus 19% elsewhere. The places least able to absorb a departure lost providers fastest.
Federal source citations
Fonteum LLC · June 11, 2026 · All figures trace to the frozen federal-data snapshot cited above.